


It’s important to utilize Google Analytics when running an AdWords campaign. Google Analytics allows you to understand how the traffic your paid search campaign generates behaves when it reaches your website. This is crucial in improving and understanding conversion rates. Google Analytics provides lots of different reports and tools to help you do this. Below I have listed 4 basic reports I recommend you utilize:
- Keyword Positions
- Destination URLs
- Matched Search Queries
- Site Search
Keyword Positions
Where to find it: Acquisition>Adwords>Keyword Positions.
The keyword positions report allows you to see how your AdWords traffic behaves when you are in different positions on the search results page. This can help you understand the best position for you to appear in on the page. Normally you are focused on gaining conversions, therefore being able to see conversion rate by position is really important. It could be that certain positions lead to high conversion rates. This could be for a number of reasons, in the snippet below you can see that the best conversion rate is actually at the bottom of the banner as opposed to the top.
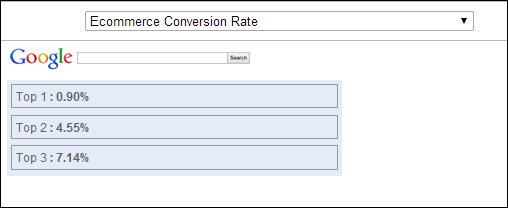
Perhaps this is because users have refined the idea of what they are looking for by the time they have got to the 3rd advert on the page and if they see what they like are more likely to buy. Seeing this data allows us to adjust our strategy and ensure our targeting is as efficient as possible. Based on the data above I would recommend reducing bids to trial appearing in position 3 over position 1, you would need to keep an eye on conversion rate to ensure this trend continued.
If getting conversions is less important to you, you might want to look at visitor volumes to work out which position enables you to get the most visitors possible. You could then adjust your bid strategy accordingly. If you aren’t tracking conversions but want to try and ensure you are getting good quality traffic you may want to pull this report for a behavioural metric such as pages per visit or average visit duration. These metrics are a good indicator of how engaged users are with your website when they click through, in the example below you can see that users are spending more time on the site when our advert is appearing in position 3 than they are in position 1. Therefore we might want to target position 3 over position 1 to ensure we are getting the most relevant traffic:

Destination URLs
Find it: Acquisition>Adwords>Destination URLs
When looking in the destination URL report, you can easily see which URL is bringing in the most traffic and revenue for you. Try applying a “secondary dimension” such as campaign, ad group or keyword to dig deeper into your metrics. For example, you may have a high volume ad group that isn’t converting. In this report you could single out this ad group and have a look at the destination URLs you are sending your traffic to. If you are testing multiple URLs you will be able to see how each URL is performing in comparison to the other. If you are sending all traffic to one URL then you can compare this to other ad groups or the site overall.
To go beyond simply understand that conversion rate is low, try looking into engagement metrics:
- How long are users spending on the site, are they bouncing?
- How many pages are they looking at?
- Are users bouncing straight away or are spending hardly any time on the site?
You can use these numbers to confirm if your landing pages aren’t clicking with the people coming in from your ads. However, if you are believe that the landing page and ad group match perfectly, I recommend adding a secondary dimension > keyword. It could be that there is a certain keyword which is leading to lower interaction rates. If this is the case, you may want to do some research into this keyword:
- Does this keyword mean something else?
- Are users looking for a different offering?
- Are competitors matching their needs more closely?
I recommend searching on Google for problem keywords, and seeing what ads come up and what landing pages are served. There could be a quick fix. If the landing page is performing similarly for all keywords, I still recommend doing some research into the industry and seeing what competitors are offering. It could be that competitors have the same product presented in a more attractive way, or a site with an easier conversion experience.
Matched Search Queries
Find it: Acquisition>Adwords>Matches Search Queries
This report allows you to see the onsite performance for the actual search queries that triggered your ads. This is useful as it can help you assess whether to add or exclude certain search terms. At a basic level try using this report to see the quality of traffic you are bringing into your website. It could be that paid search has a low time on site, however when you look in the matched search queries report you notice that a lot of your matched search queries are competitors names and therefore time on site is low because users are clicking through and realizing this isn’t the site they wanted. By linking GA metrics with your search queries you can make better judgment calls for adding or excluding terms.
The great thing about this report is there is the ability to delve deeper through secondary dimensions. For example, if you are surprised a query isn’t doing well, you could have a look at the keyword that it is being matched from, you could also look at the URL the traffic is being driven to. It could be that the ad that is being served is too generic or less appropriate, based on this you could then move this variation into another ad group with a targeted ad to improve performance.
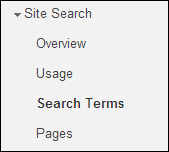
Site Search
Find it: Behaviour>Site Search
This feature involves a tiny bit of set up, here are full instructions. Site search allows you to track what users are searching on YOUR website. Why is this useful? Because it allows us to see what traffic that is already on your site is looking for.
There are 3 reasons why this is useful for paid search account managers:
- It allows you to see what people want and this could provide inspiration for further ad groups. For example if everyone is searching for “burgundy vans” and you only have ad groups around red vans, you could gain additional traffic from paid search.
- You can see what people cannot find on your site, if you are driving all traffic to a general vans page and everyone is searching by colour in the search box it suggests that you need to add filters or new pages to improve the customer experience.
- You can see what % of users are using site search. You can see this just for paid search by applying an advanced segment. If the majority of users are using site search this suggests that the landing pages you are using aren’t fulfilling users needs.
All 3 of these can help you improve the user experience from paid search and influence your strategy.
Next month I am going to focus on how you can utilize Google Analytics insights to improve your bid multiplier strategy in AdWords.
