


Paid search and Google Analytics work hand in hand in so many ways (including right there in the AdWords interface). This month’s series week is all about how you can make the most of Analytics in your account, whether that’s with content experiments, event tracking or custom reporting. We’re going to find all of the ways that you can get even more insight into the clicks that you’re paying to get.
Hopefully it comes as no surprise that Google AdWords and Bing Ads interface data are not the end-all-be-all of PPC analysis. To kick off this month’s series on Google Analytics, I thought it might be a solid start to review a handful of the standard reports available in GA that you can (read: had better be) using to optimize your paid search campaigns.
The one thing I will say is that for the purpose of this post, I’ll mostly be looking at data for paid search traffic. To filter down to this layer and be sure you’re only looking at Analytics numbers for what you’ve sent through via PPC, you’ll need to go to the Advanced Segments tab at the top of the Analytics interface. From here, simply select the ‘Paid Search Traffic’ check box, hit Apply and you’re set.
When I’m looking at all traffic data, I’ll be sure to mention it in that section.
Now that we have that settled, here are the Analytics reports I recommend you take a look at to further optimize your PPC strategy:
- Audience – Demographics
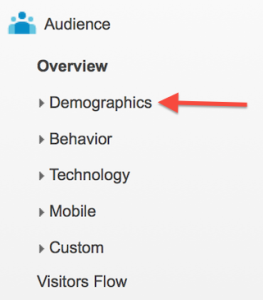 This one we can keep kind of short and sweet. When filtered down to only PPC data,the heat map report that comes up to show what countries are coming through your paid search ads is really helpful. It lets you see what areas you may not be targeting or optimizing for already and come up with a new strategy for those regions. Yup, that’s it!
- Traffic Sources – Sources (**ALL TRAFFIC ANALYSIS**)
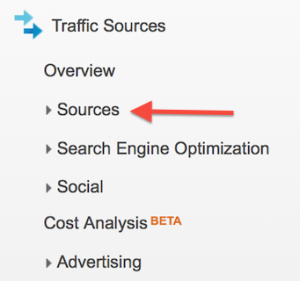
I periodically dig in to the All Sources report to see which of my traffic sources has the highest bounce rate, or the highest percentage of new visitors. From these two reports your can get some ideas of which sources may need more specific remarketing strategies set up to target and bring back in to the site/funnel. You combine the bounce rate with new visitors and you can narrow your focus to those sources with the biggest total traffic impact.
Further, you can see referral sources in this report, which can help you see where traffic may be coming in to the funnel from new(er) places that you may need to begin strategizing around more directly (i.e. LinkedIn, etc.)
- Content – Site Content (Landing Pages)
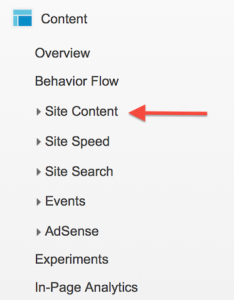
This is where you get to start looking at the next layer of PPC optimization beyond the click – conversion rate optimization. With your paid search traffic-only filter applied, which landing pages that receive PPC click traffic have the highest bounce rates? Take a look at those pages with an objective eye and try to figure out why – load speed? No content/information on the page? No form available for the consumer to fill out? Start putting together CRO testing hit lists for each landing page on your site that receives PPC traffic and get to it! Pushing through the clicks is one thing, but long term success is going to be hinged on ensuring those clicks convert.
- Conversions – Multi Channel Funnels
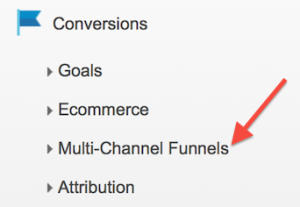
Multi channel funnel reporting is automatically going to push you to analyze all traffic and where it overlaps, but specifically we want to look at where paid search traffic overlaps with other traffic sources. I find this report most beneficial when showing the value of PPC across other channels. Pulling a report that shows where direct traffic visitors originated from PPC clicks at some point in the conversion funnel can be incredibly useful when it comes down to understanding the true contribution of paid search clicks to the online marketing picture.
Additionally, you can see where Display and Search traffic interact and how many conversions or leads you might miss in a given time frame if the two segments couldn’t be there to push the consumer through the end of the funnel. As interest in Display from a client standpoint increases, and as we get more maneuverability in the segment as account managers, it’s incredibly important to show where Display traffic isn’t always the direct conversion push and that can’t be the only metric reported on for that PPC spend. If you don’t look at the indirect conversions you get from Display, you’re not looking at the whole picture and could risk cutting out this traffic without realizing it if you don’t look at the multi channel funnel reports within GA.
- Custom Reports
What would a good series be without a cliffhanger?! Jacob will be covering some custom reports in his post on Thursday…so stay tuned!
The rest of the Analytics series this week is going to cover content experiments, events tracking, and goals/visitor flow tracking, so seriously be sure to check back in each day and get the next post full of GA awesomeness.
How do you use the standard reports in Analytics for your PPC campaigns? The reports mentioned above also, of course, aren’t the only standard reports available – which others are your favorites? Share your thoughts and ideas in the comments section below!
