


The holiday season has a reputation for housing much joy. Roaring fires, turkeys or hams roasting in the oven, the company of loved ones, and whatever comforting liquid with which you prefer to fill your glass. It’s all very idyllic, to the point where it’s been immortalized in song as “the most wonderful time of the year.”
A song that probably was written in blissful ignorance of the plight of the PPC Account Manager— more specifically, the lead generation PPC Account Manager.
While the savory scents of holiday meals waft through homes, and while gifts are merrily wrapped behind closed doors to be lovingly deposited beneath the tree, the PPC Account Manager is a gruesome anomaly amidst the picturesque setting— rocking back and forth, head clutched between hands, sweating coldly, because oh my God performance is plummeting.
In many industries seasonality is a harsh truth— not something to be avoided, but rather something to be accounted for. The Account Manager who values his or her sanity has learned not to live and die with seasonal performance— winter is a time for merriment, not for biting our fingernails and pulling our hair out.
But that’s a road traveled both ways, and, in keeping with our wintry theme, a treacherously slick one.
All too often account managers will point to seasonality as a scapegoat for poor performance, when in reality the deficiencies may be coming from within the account.
The following is a wonderful, data-oriented approach to extracting from your accounts whether a performance dropoff is actually seasonality, or if that’s just the floating block of ice you’re clutching to as you try not to sink into the depths.
There is one small requirement: year-over-year data. If you don’t have performance data from the previous year, it’s time for a candid conversation with your client about their business and seasonal trends. But this post isn’t about client relations, so onwards we trudge.
Step 1:
Look at your month-over-month data for 3 months from the previous year. In Excel, it looks like this for me:

Step 2:
Time to calculate your month-over-month percentage shifts. Do this simply by subtracting the CPA of the second month from the CPA of the first month, and then dividing the difference by the CPA of the first month again.
So, using the data pictured above, the equation that is yielding the month-over-month difference is as follows:
CPA Oct 2013 (5.18) – CPA Nov 2013 (4.86) = MoM Change (0.31)
then
MoM Change ($0.31) / CPA Oct 2013 ($5.18) = 0.0605 * 100 = 6.05%
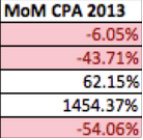
Hey, alright! Now you have your month-over-month percentage change for last year. You see that on 3 of my 5 accounts here (all a part of the same company), our CPAs spiked from October to November a year ago. That’s one of two components you need right now. The second piece? That same piece of information, but for this year.
Go ahead and rinse and repeat that formula, and you should end up with your MoM change from October to November for both 2013 and 2014. Now we’re cookin’ with fire.

So now, let’s look at your percent differences side by side.
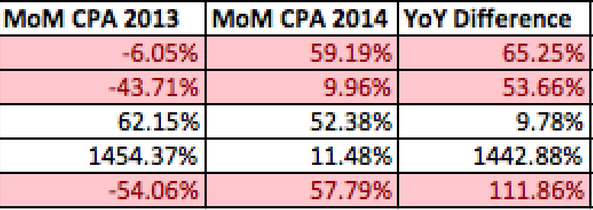
Hm, well that’s pretty revealing, isn’t it? Get the YoY Difference column by subtracting MoM CPA 2014 from MoM CPA 2013. The closer the YoY difference column is to zero, the more likely it is a component of seasonality, because the performance has suffered similarly in consecutive years. The higher that number is, however….
Now, instead of looking at this year’s 59.19% CPA decrease and thinking “hoooboy, seasonality’s come a’roarin’ this year!”, I can see that the previous year, over the same two months, CPAs actually decreased.
Yeah, probably not seasonality. And now, because I’ve done the research, there’s going to be the awkward moment on a phone call when I cry “seasonality” and the client wags his or her knowing finger at me.
This methodology can, of course, be applied to any coupling of months, and any coupling of years. Want to look at how April performed compared to September in 2012 compared to April and September two years later? By all means…
So, there you have it. Don’t be caught using seasonality as an excuse for poor performance, when the truth lay in the data.
(featured image by Jeff S/Flickr)
