


Do you ever wonder why your Analytics revenue for the month is higher than your AdWords revenue during the same time period? Wouldn’t AdWords be more likely to give itself credit? What is more than likely occurring in this situation is that Analytics is attributing revenue to the current month from clicks that occurred last month, while AdWords attributes that revenue back to the click. This scenario is a common occurrence in accounts and is something that needs to be taken into consideration as month-over-month data is reviewed.
Awhile back we looked into this and came up with the process to calculate expected lag revenue in AdWords with the attribution -> time lag report that AdWords provides. However, with this model, you need to re-pull conversion and revenue volume for every day of the month each time you want to look at the numbers. With Supermetrics, this process becomes much easier.
What Is Supermetrics?
Supermetrics is a tool that helps to bring in data from AdWords, Bing, Analytics, Yahoo, Facebook, etc. and easily segments the data the way you want to see it.
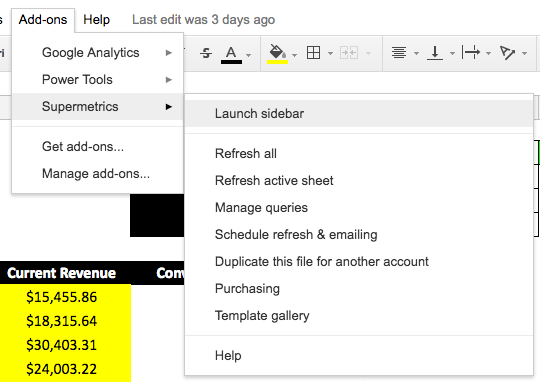
Once you have Supermetrics downloaded as an Add-On in your Google Sheets account it should show as seen above. From there, you can launch sidebar, select accounts, and select the way you want to visualize the data. For the lag revenue analysis shown below is what you would want to pull the data in as.
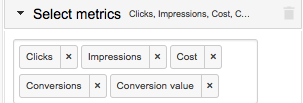
Metrics
Pull in the metrics that you need (in this case you’d really just need the conversion value, but we pull in the other usual metrics as well):
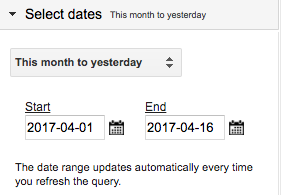
Date Range
Assure you’re pulling month-to-yesterday as your date range, it will allow the tool to show projected revenue based on numbers being shown from yesterday.
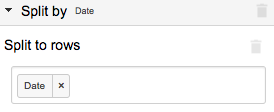
Split By
Next is the split by section. This section is normally where you’d put campaigns or ad groups or locations, but in this case, we just want to split by date – meaning we want the information on a daily basis.
Creating The Supermetrics Lag Revenue Report
Once you have this basic Supermetrics raw data sheet in place, you can then create the lag revenue report. First, fill out the projected percentage of revenue that has come through on a day’s worth of clicks based on the information seen in the time lag report in AdWords. You can find this report by going to “Tools -> Conversions -> Path -> Time Lag -> From last click”
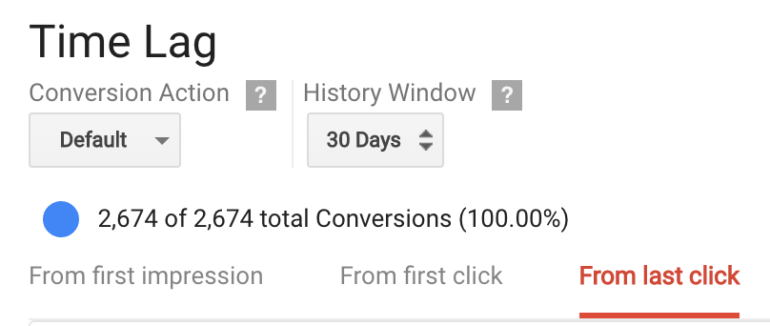
It’s crucial to assure that the report is showing from last click in order to better align with the allocated revenue from the previous months that you’re comparing the current month. Once you have all of this information you’ll create the chart as seen below:
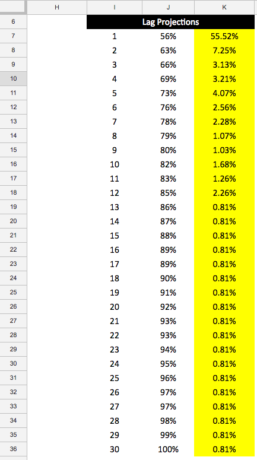
You’ll fill out the yellow part of this report and then formulate the section before by adding the cell above and the cell to the right in order to come up with a total amount of conversions accounted for based on the number of days that have passed by.
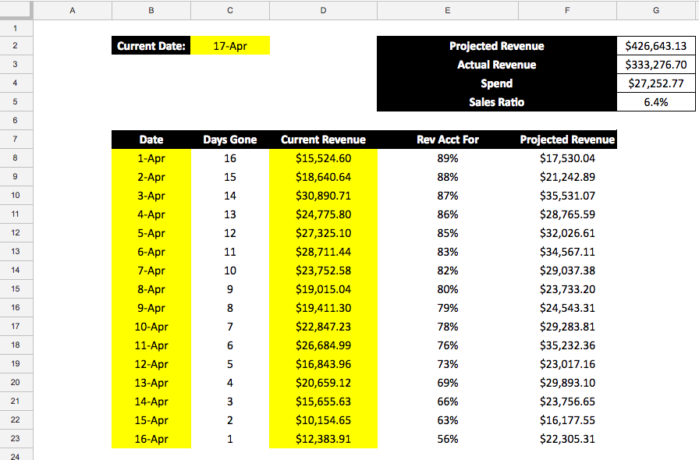
From there you’ll be able to set up a final report like the one seen below and it can refresh automatically with the click of a button (or schedule) via Supermetrics.
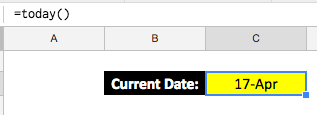
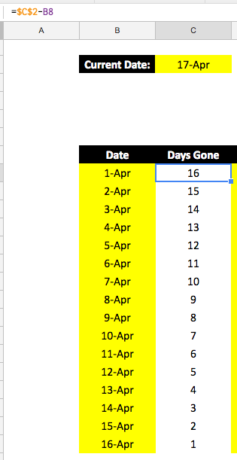
To get the information above, you’ll have to use some formulas before it is completely automated. First, in the Current Date section use =today():
Use this to get the days gone column filled by using Date-Today() as seen below:
From there you need the current revenue amount per day to predict the total revenue amount to come in based on past performance. The current revenue information is pulled through the Supermetrics sheet.
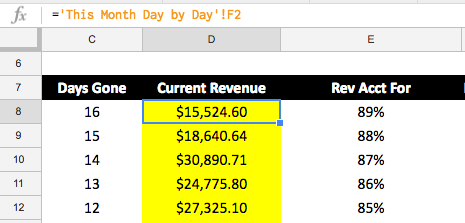
This number is easy to pull over from a separate sheet because it’ll be in proper order on both sheets. If you do not have your data listed in proper order by day for whatever reason, you can still use a SUMIF here, but typically this would not be needed for this report.
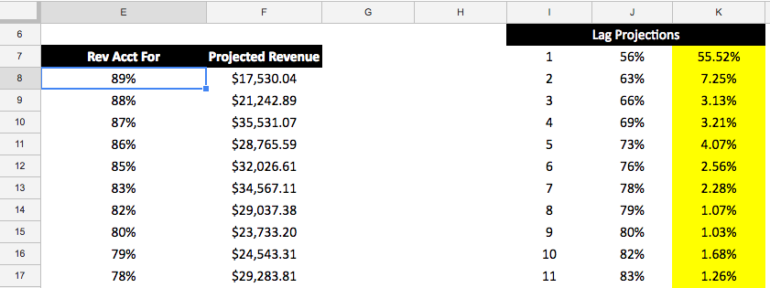
Finally, the VLookUp is performed to get the estimated revenue accounted for based on the lag revenue numbers from the past that you pulled into the report:
Conclusion
Once you have taken this final step, your project is complete. Moving forward, you’ll just drag the rows down when a new day occurs and hit refresh if you do not have it set to automatically refresh and you’ll have your lag revenue report. Supermetrics is a fantastic tool that can be used for all sorts of reports and optimization tactics. This tactic is one of the less common uses, but it is also one of value. More post are to come on how to best utilize Supermetrics for reporting and optimizing as efficiently as possible in your accounts, so stay tuned.
