


To most folks, finding (non-Remarketing) success on the Display Network can be an elusive goal. This vast conglomeration of partner sites can, without proper management and restraint, place your paid advertisements in front of just about anyone, anywhere. They’ll usually spend a lot of money in the process, too. However, with a consistent approach and careful eye towards efficiency, you can find Display-fueled success that exceeds your wildest expectations.
The backbone of any successfully-ran Display Campaign lies in the careful, ongoing analysis of your Placement reports. This is a pretty routine task for any PPC account manager, diving in to the Display Network tab on a frequent basis to find the following:
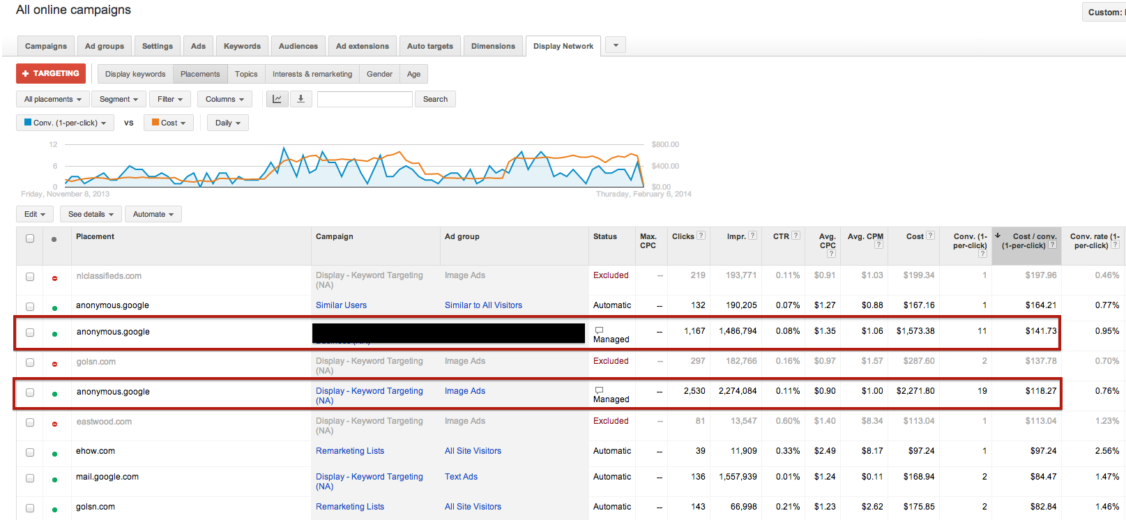
In this account, over the last 90 days, we’ve got a few placements that are prime candidates to be paused. For an account with an $80 Cost Per Conversion goal, a couple of these ad group/placement combinations are pretty out of line. However, I’d like to state my case for the following tactic:
- For a search keyword, we have detailed knowledge of the exact queries that comprise that keyword’s statistics. We can audit these queries according to performance, relevance, and intent.
- For a contextual keyword, we don’t get the same level of insight – the placements are matched with your targeting parameters based on the site content. You won’t find any queries here.
You might be thinking “well, that’s what the placement report is for, right?” And you’d be partially correct. But contextual keywords don’t match up with sites, they match up with the pages contained within.
This is a long-winded way of saying that you should audit your page placements, in addition to your site placements. How, you ask? With the “See details” menu.
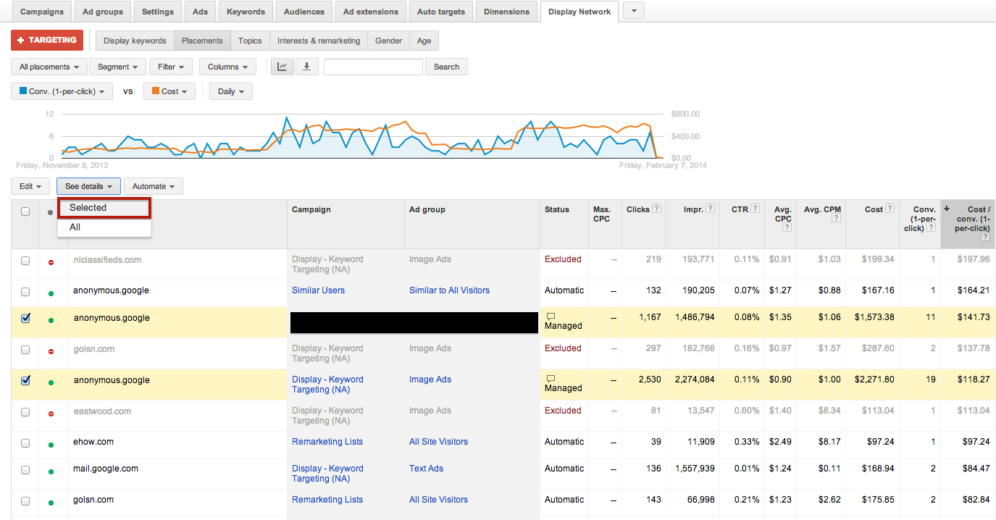
In the above example, we’ve highlighted two placements that, while high in conversion volume, are enough above our CPA goal that we might need to exclude them going forward. It’d be a pretty painful cut, though, as they make up about 10% of this account’s Display Conversion volume. However, looking at the Placement Details button tells us a different story:
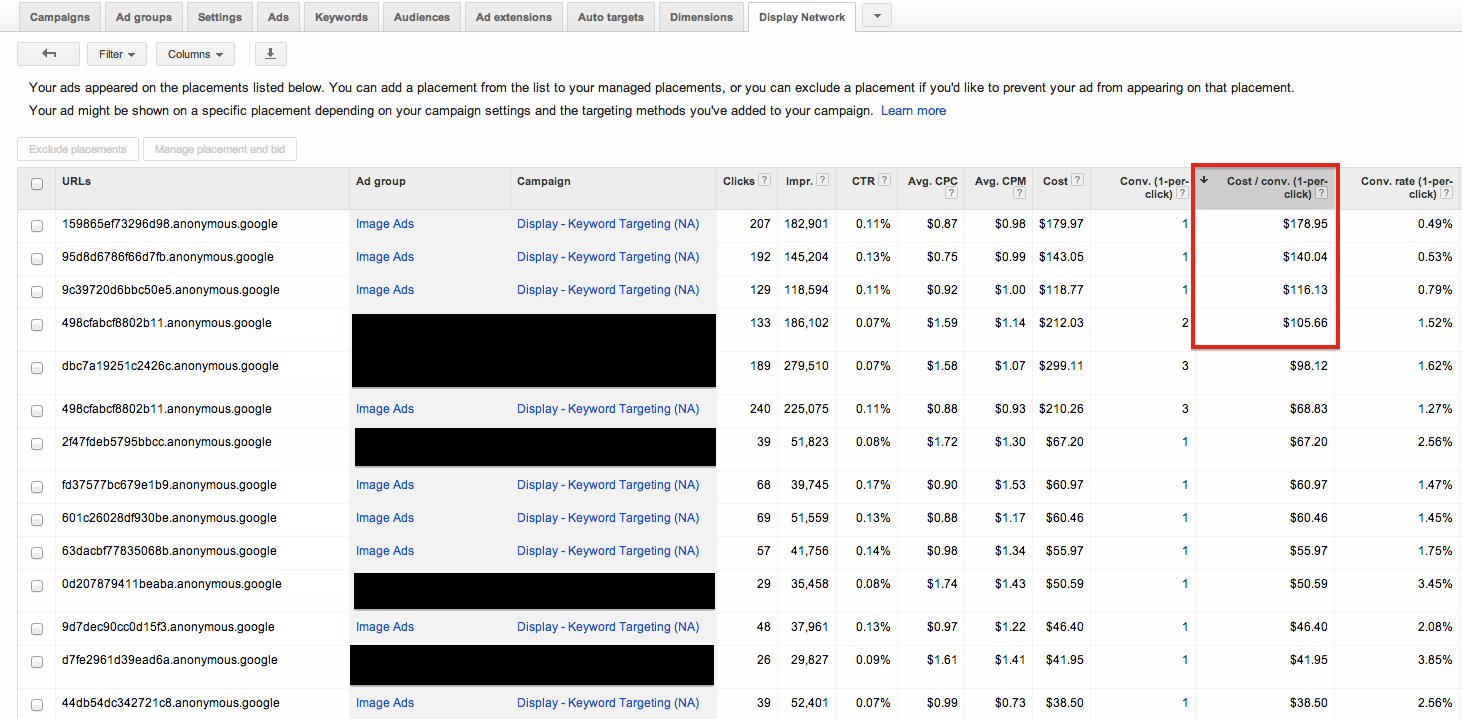
Admittedly, the fact that the placements are “anonymous.google.com” makes this example less dramatic. But it’s important to note that these two placements are actually comprised of 347 different pages – the exact same way a phrase or broad match keyword has hundreds or thousands of queries.
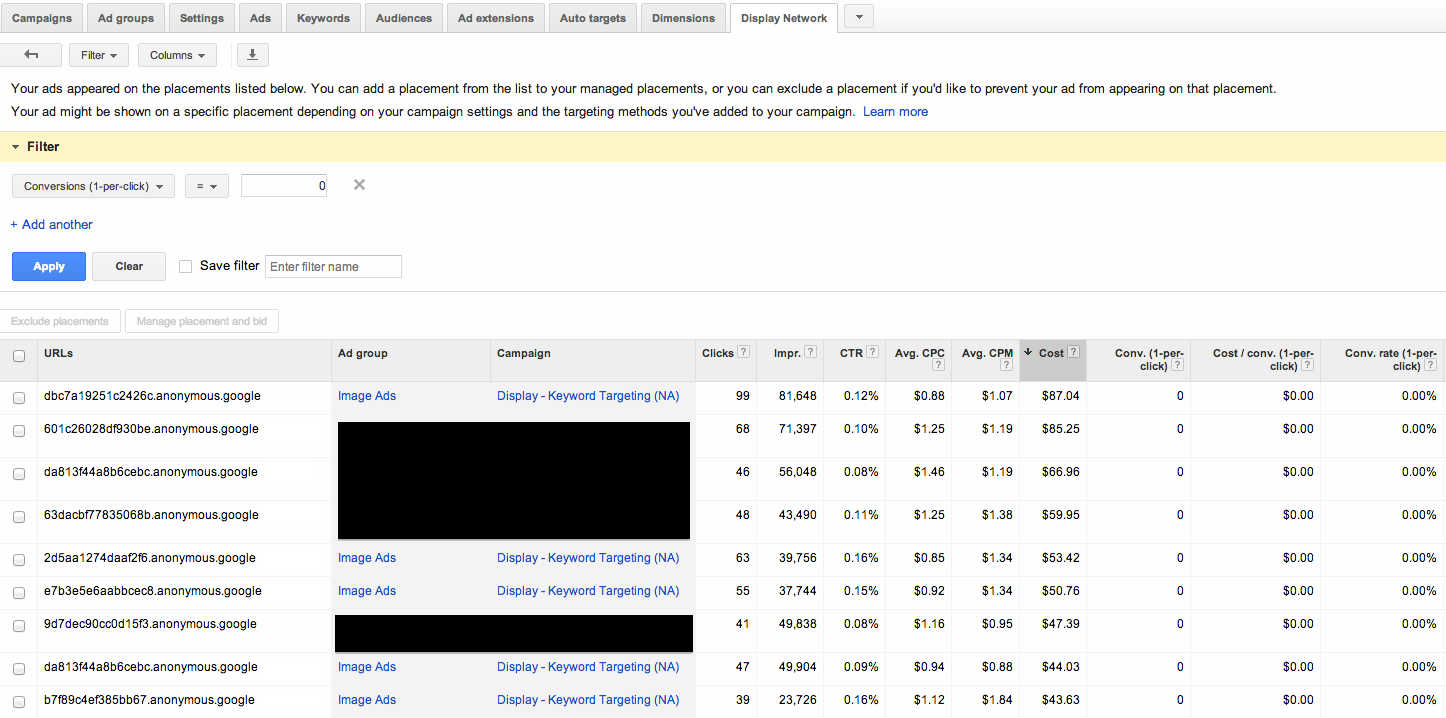
In this case, we’ve got a few URLs skewing our overall CPAs – one more than double our stated goal, in fact. We’ve also got several pages with a significant level of non-converting spend):
For reference: between the two placements as a whole, they total $3,845 in spend for 30 conversions – an overall CPA of $128.
Excluding the high-CPA and non-converting spend display in the images above brings our total down to $2,625 spend and 25 conversions – an overall CPA of $106, a reduction in CPA of 17%.
If we went so far as to cut all high-CPA and all non-converting spend? We’d have a CPA of $41.52 – a 67% reduction with a minimal impact on conversion volume. That may be a *bit* drastic, though, as some of those cuts will come from pages with a statistically insignificant level of traffic. Still – a significant savings by any measure.
It’s a pretty simple tactic to execute, but one that doesn’t get a lot of attention. If you’ve got some hard decisions to make regarding your own placements, dig a little deeper in to your placement details and see what kind of savings you can find!
