


In recent years, account and client complexity have increased. As we sign big companies that advertise in multiple accounts for multiple brands, it’s important to keep a pulse on how these accounts are interacting with each other.
The Situation
Let’s pretend we have a Company X, which owns brands 1,2, and 3. Each of these brands advertises in their own accounts, on similar (sometimes even the same) keywords.
Desired Outcome / Key Questions
With any important piece of analysis, it’s a good idea to start with the desired outcome and list out the key questions you’re aiming to answer. This will help focus your analysis so you are less likely to get lost in the weeds.
In this scenario – we want a breakdown of the following:
- Is one brand impacting CPCs of the others over time?
- How often are we double serving?
- Which keywords overlap?
- How do their impression shares compare?
- Do certain keywords perform better for any particular brand?
Getting the Data
Let’s pause to think about exactly what we need to see in order to answer these questions.
We know we need a keyword report, so let’s start there. Metrics or segments that we need include:
- Impressions, clicks, cost, conversions – basic metrics that we can use to calculate things like CPC, CVR, CPL, etc.
- Segmented by quarter – so we can see trends over time
- Impression share – we’ll also pull an auction insight report, but I like to include impression share here as well to dig to a keyword level
Next, we’ll pull an auction insights report from Google Data Studio. For this report, we’ll pull the data by campaign, auction insight domain, and month. Metrics to include are impression share and overlap rate.
Manipulating the Data
Now comes the tricky part (or as I like to call it – the fun part): manipulating the data so that it’s usable. Let’s start with the keyword data.
Keyword Data
Our campaigns are named consistently (which I highly recommend for any PPC campaigns), so it’s easy to pull out which brand each campaign belongs to. In this case, the naming convention is Brand_Category_Network_Geo, so we can use either text-to-columns or LEFT() to grab the Brand name.
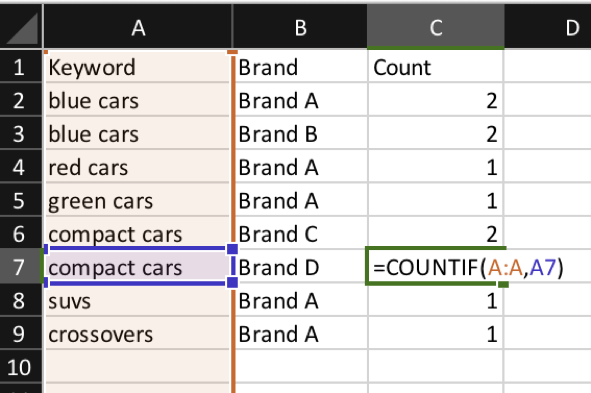
Next, copy the Keywords & Brands only to a new sheet, and remove duplicates. This will give you a unique list of keywords that exist within each brand. To get a count of how many brands a keyword exists in, simply do a COUNTIF.
Next, we want to be able to easily identify keywords that exist in both of the selected Brands. I’m a big fan of Data Validation to create dropdown menus for easy brand selections.
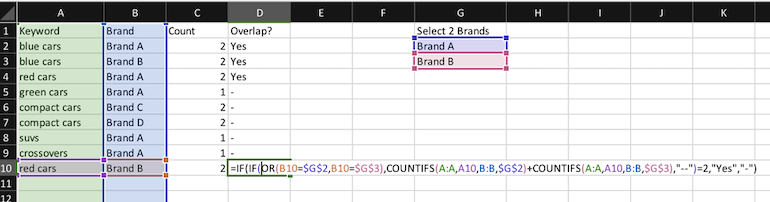
In words, the formula does the following:
If the brand is either Brand A or Brand B –> count the number of occurrences in each brand. IF there are 2 total occurrences, this means that there is overlap, and “Yes” should appear in this column.
Now we can create a new column in our original keyword data sheet, and VLOOKUP this new “overlap” column. Now we can easily pivot our data.
Auction Insights Data
Similarly to the keyword data, we’ll start by parsing out the Brand name from the campaign name. Easy enough!
We also need to label each auction insights domain identifying if it’s one of our brands or not. To do this, we create a list of all of our domains and do a VLOOKUP.
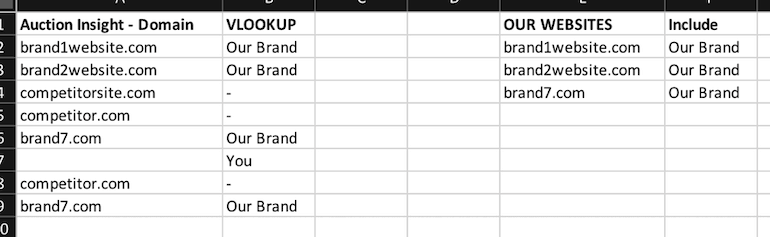
Notice the blank entries under Auction Insight – Domain: in the interface this appears as “You”, so we simply relabel it here.
Now this data is also easy to pivot! Onward!
Actionable Pivot Tables & Working Through the Data
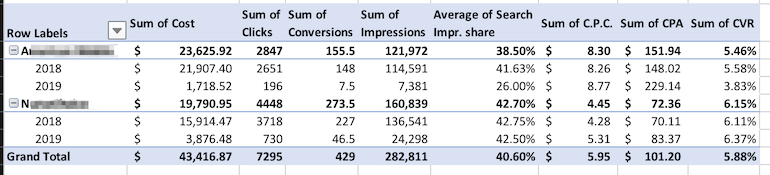
At this point, we can start pivoting and graphing data to look for any interesting trends. Here are a couple of examples.
These two campaigns are the same across two brands. One has higher CPCs, higher impression share, but lower conversions.
Let’s take a look at the auction insights graph.
First we want to segment the campaign in question, other brands that we own, and competitors.
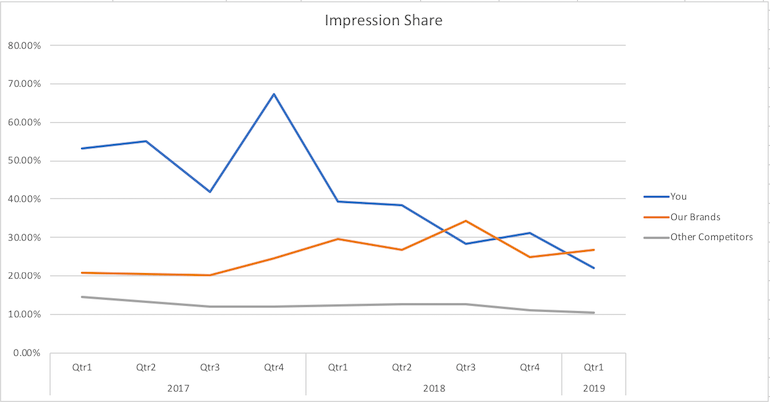
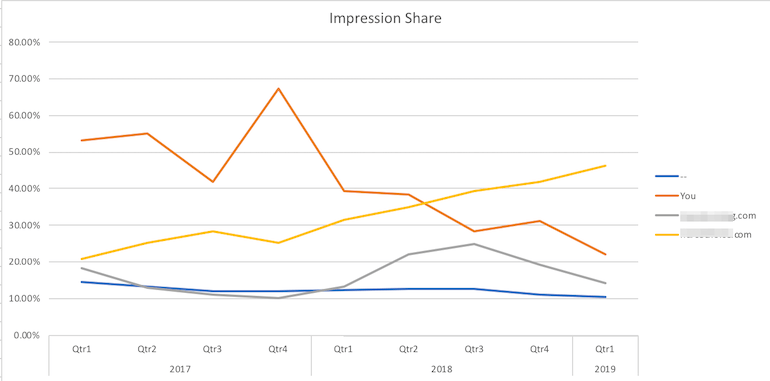
We find that other competitor impression share has remained relatively steady, so let’s see if there’s any specific brand that’s increasing.
Other Important Considerations
Context is king, and there are some important things to think about when doing a comparison such as this one. Consider the following:
- Do the brands track the same types of conversions? This can be an important factor that you may need to add an additional segment for. One brand may look like it performs substantially better, but it may be tracking a bunch of less valuable conversions (leads vs. sales, applications vs. placements, etc.)
- Are the websites drastically different? Is one running conversion rate optimization, and the other isn’t? Look at differences in form lengths, cart checkout processes, and so on.
- Geo targeting considerations – if campaigns are segmented by geo, make sure to dig in at the campaign level to account for these differences.
- Company initiatives – one brand may have a higher demand than the others, leading to a push in budget. Even though this brand may not have the best CVR or CPL, there may be other business decisions behind favoring one.
What Do I Take Away From This?
The list of questions we compiled in the beginning should help drive the action items and takeaways. The hard numbers should spark a conversation with the client (or your teammates, if you’re in house), with some focus especially on the considerations mentioned in the previous section.
My overall recommendation would be as follows:
For brands that don’t have any major reason to give preference for one brand over the other – considering boosting the brand with the better conversion rates, CPL, and so on. Monitor performance over time, checking in maybe once a quarter. Once the reports are set up, it’s relatively easy to re-pull the data and dump it in, then refreshing the pivot tables.
For brands that have significant differences in company initiatives or conversion value – adjust according to these stipulations, but the recommendation to monitor performance and check back in remains the same.
Need more tips on how to manage multiple brands? Check out this article by PPC Hero Lara Lowery.
