


This week we’ve been discussing the Back To School season, arguably the biggest thing to hit e-comm since the winter holidays! There are many details to consider when approaching your first Back To School campaign, or when simply evaluating when and how to set this year’s BTS efforts live.
Today we’ll cover the first steps of not only knowing your own traffic, but also getting familiar with industry behavior and understanding your customer’s buying cycle. If you’ve not yet anticipated your PPC Back to School timeline, these tools will assist you with the process. And if you have begun drawing in BTS shoppers, you’ll be able to nail down some of the performance you can over the coming months.
Know Industry Traffic
Some of the most fun we numbers nerds can have is looking for trends and digging through data. And lucky for me, Google and the National Retail Federation provide LOTS of it, especially when it comes to seasonal trends. If you haven’t yet checked out these resources, go now. I’ll wait.
From these databases, we’ve seen a lot of important insights and trends.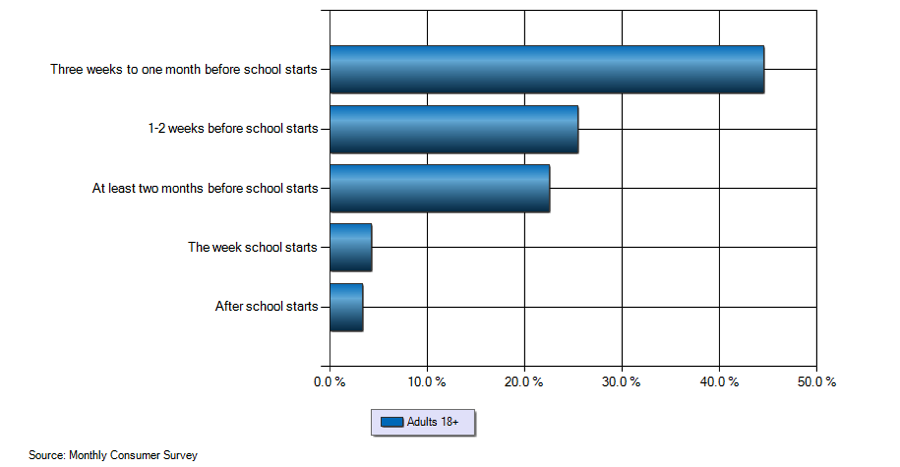
This is one of the more important NRF graphs for assessing your BTS strategy. As we’ve said time and time again, you need to prepare in advance so you’ll be ready when the shoppers start their engines. From the table above, we can see that the majority of surveyed BTS shoppers are making their purchases 3 to 4 weeks before school starts. About half of those are shopping 1-2 weeks before school starts, closely followed by over 20% who buy their supplies 2+ months before school starts. You don’t want to be the retailer marketing to that <10% of shoppers who are getting around to their purchases as school is beginning.
Pro Tip: Not all schools start at the same time. If you’re deciding your timeline by commonly accepted Back To School windows, you best think again, pal.
Schools across the U.S. are starting as early as July and as late as September. Using vague estimates is seriously underestimating what you’re capable of during a season that most closely rivals the winter holidays.
In addition, let’s consider the impact of mobile devices during BTS shopping season. Below is a table listing responses of Smartphone users when asked about how they use their phones: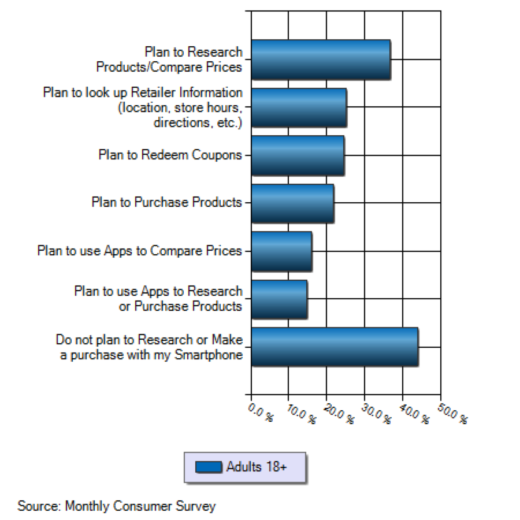
Let’s go over the major points:
Only about 22% anticipate making purchases on their phones, but over 35% will be researching their products of choice by phone. In fact, over 40% have no intention of making purchases with their smartphones at all. Yet this survey gives concrete input about the value of the funnel, through price comparison, location details, and redeeming coupons.
Your takeaway: All e-comm vendors have a mobile presence, you just need to identify where. For some, it’s through a clear transaction volume. For others it will be in the “research” stage of shopping. Your multi-channel funnels will be your golden goose in this scenario and there’s no such thing as getting too familiar with your funnel.
A final tool to use is Google Trends. Sure they can tell you what fruits are currently being affected by a listeria outbreak, but they can also give you an idea of when the bigger world of retail is beginning its BTS shopping.
In just the last 30 days, there has been a clear uplift in the number of searches based on “back to school” terms.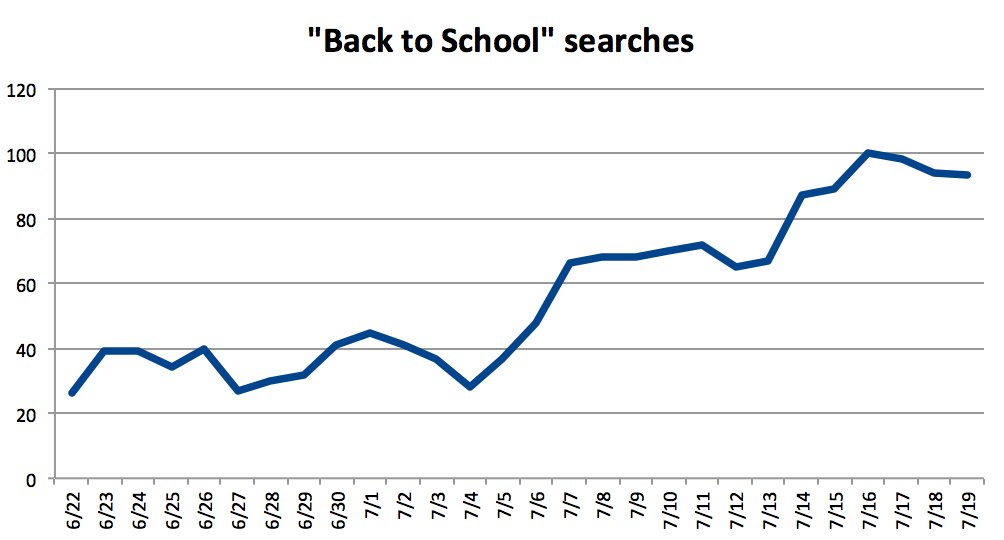
Google Trends allows you to select your location, your timeframe, and your specific terms. It then estimates the search traffic it commonly sees. Bonus: You can even choose what network your results cover, from Web searches, to Shopping, to You Tube, and so on.
KNOW YOUR TRAFFIC
If your account has already seen a BTS season or two in its time, then you’ve got some data to work with. As always, it’s important to segment your data into useful takeaways. Specific to the BTS season, the 3 ways to begin looking at past performance are through device, geotargeting, and your account management.
-
Device – As we know, the shopping process often begins long before the purchase. Much research is being done on desktops months in advance or on mobile devices while walking through stores. It’s imperative that you identify this distinction, particularly in your own account. In order to do this, you’ll need to look through your PPC interface as well as your Analytics account.
Let’s look at this example of last year’s performance from the 14 weeks of the BTS heyday, June 1-Sept 1. Here we can see the session volume segmented by device: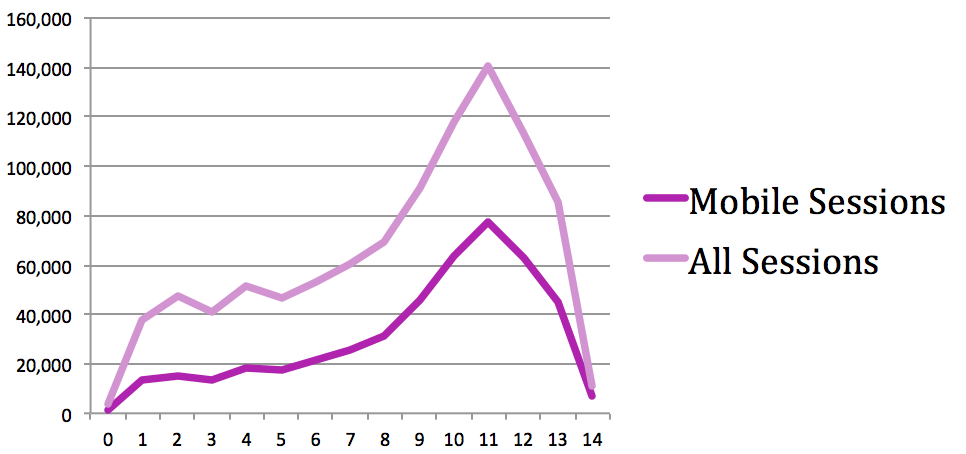
Clearly there were some big areas of increased traffic (from week 0 to 1 and then from week 8 to 11) and then two different periods where session volume just dropped right out (week 11 to 13 and then a final plummet from week 13-14).
Another view shows the transaction volume by device: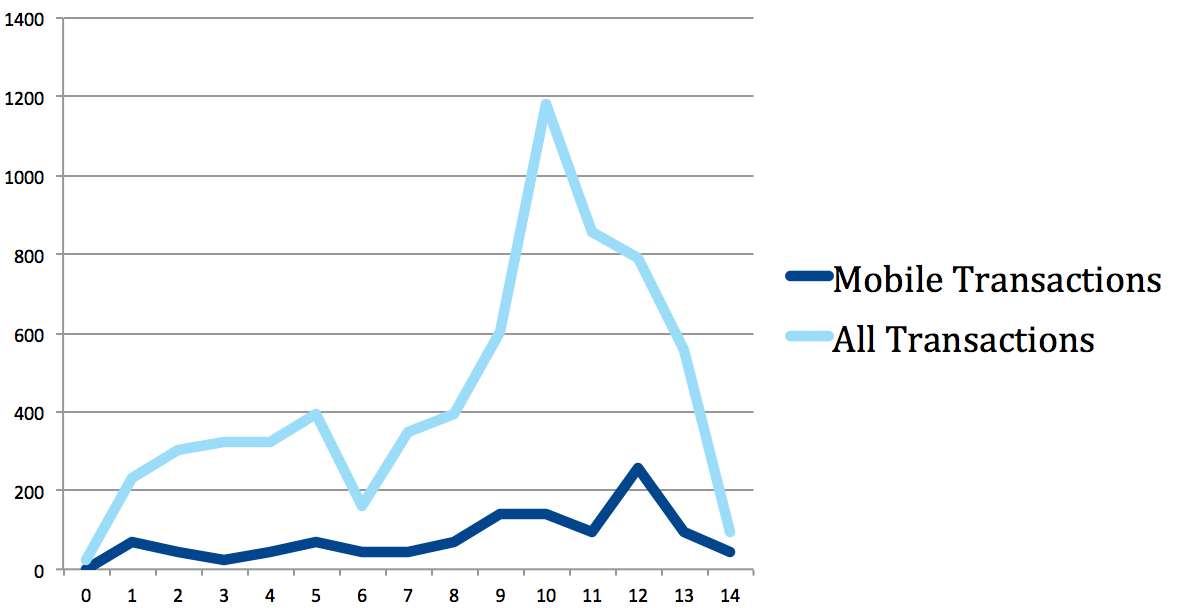
Similarities? There is a big boost to all transactions from week 0 to week 1 & 2, as well as a huge spike 2/3 of the way into the season. The differences in transaction trends v session trends are also very apparent. While week 4 is big for sessions, the following week has the higher transaction volume. Also, you’ll see that the visitor peak is in week 11, yet the transaction peak occurs in week 10 for All Devices and week 12 for mobile.
Interpreting the data: Whether you choose to look at session volume, transactions, devices or other segmentation options, the goal is to generate concrete insights from the data. From these two charts I can:
- Identify the periods during which I’ll need to constantly be checking my campaign availability
- Review my inventory from last year to highlight any “out of stock” products that sold during that beautiful week 10 peak, and may have been unavailable for all of those sessions that occurred in week 11. If it was an inventory issue, I need to make sure I’m keeping a much closer eye on what’s running out and how I’m encouraging my visitors to look at similar product options.
2. Geotargeting- This type of report is useful through other segmentation as well. Let’s look at how your account performed by geographic region.

Again, the takeaway – a key fact, point, or idea to be remembered – is the most important thing. What does the data tell us? Here I’ve highlighted where some inefficiencies are being seen during the Back To School window. I can see how these regions have performed year over year and where the most spend is being used and where the most sales are coming from. Clearly, the states highlighted in mint green are the greatest contributors to the BTS spend as well as by conversion volume. Those states in highlighted in cornflower have certainly spent their fair share, but have not yielded the same volume. If you’re working on a CPA or ROAS goal, you’ll want to pull these types of reports prior to the BTS launch and during your season.
3. Account management – Lastly, be sure to reflect on last year’s performance for anything that may have held you back. If you managed it, I’m going to hope you took great notes throughout the season, which you then framed and placed on your desk for this very moment! If you inherited your account and don’t have the play-by-play, it’s time to dig back into your account.
The two things I always check are relative performance and account change history, including budget usage.
1) For relative performance, the best place to start is your overall impression share versus the rest of the e-comm world. What was your search impression share? I took a look at my search IS due to budget and saw this:
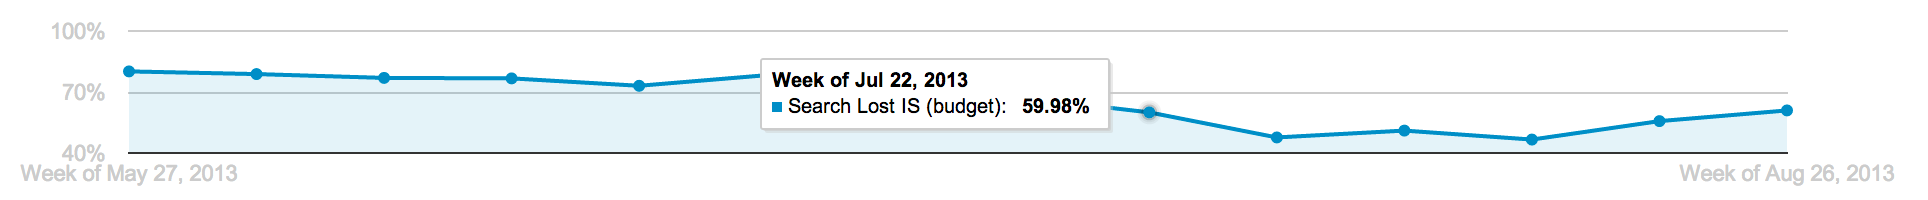
At what point did my impression share catch up? Late July. From what we know from our previous segmentation (tl;dr), the 10th and 11th week were top performers for us last year. This graph reflects an interesting bit of information: Week 10 was the first time at which our budget-based IS loss dipped under the 50%. And it coincided with some of our highest traffic (visitors and purchases). Seeing this should flip a little light switch in your PPC brain: Didn’t I ration my budgets properly??

Which brings us to point 2: Your account history!
2) The great part of your PPC account is the long memory it possesses. If you inherited your account, or just don’t remember what you did, go back into your Change History and check it out. As mentioned, your budgets probably had the biggest impact on your success, followed by your bids. Grab the change history from your BTS season and sift through it.
(Note: If you’re an Excel enthusiast like myself, you can easily categorize your history into major categories, such as budget increase, bid changes, targeting adjustments, and so on).
Where to Start
Although you’ve got lots of pointers for where to go with your BTS campaigns, you certainly deserve a quick and easy checklist for your account:
– Prepare your budget. Know how much you can spend and where the line is drawn. Many retailers go with the approach “if the return is there, spend away!” but if you have more concrete restrictions, identify your best initial pace.
– Get your Shopping campaigns optimized. Using your priority levels, bids, and negatives will allow for reduced waste and more targeting spend allocation.
– Go live with your BTS campaigns just a bit ahead of the curve to ensure that all ads are fully approved and that your settings are as they need to be. As we all know, new campaigns don’t just pick up and perform overnight, so be sure to give yourself a few days of wiggle room.
– Get competitive with your ad copy! Find your best line and use it now, while traffic is at its high point.
Hot Tip: 80% of consumers surveyed are more likely to purchase a product online when offered free shipping. (2014 Future of Retail Study) Whether your shipping is free only after a $100 total, only on Tuesdays, or only for certain regions, if you’re able to get this message across, your customers will respond.
As you continue to build and optimize your BTS campaigns, we’ll continue to give you pointers on how to spend your budgets for the greatest efficiency and highest return. Stay tuned this week as Kayla Kurtz, Matt Umbro, and our own Jersey Jeff offer even more Back To School tips!
