


Is the math aspect of PPC your least favorite part of your job? Does the mere mention of the word “algebra” anxiety-inducing? Are you not a “numbers person”? Or maybe you’re just a PPC newbie and you’re wrapping your head around what all of the numbers and metrics mean.
Fear not, friends. PPC Hero is here to help. In today’s post, we’ll walk through some handy PPC equations and how they are used.
Estimate Starting Bids
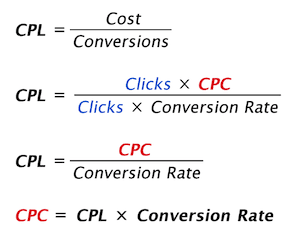
If you’re launching new keywords, or simply reevaluating your current bids, it’s useful to calculate at what CPC you are profitable. To do this, we multiply the CPL goal and the historical conversion rate. At a glance, this doesn’t seem intuitive. Here’s how we derive that equation:
Now that we have derived the formula, let’s plug in some numbers for an example.
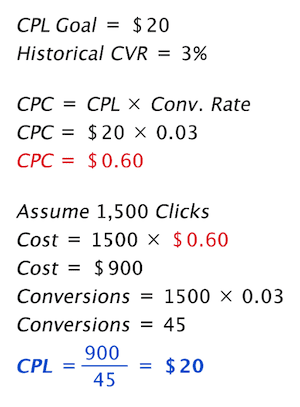
In this example, our CPCs should not exceed $0.60 to maintain a CPL of $20.
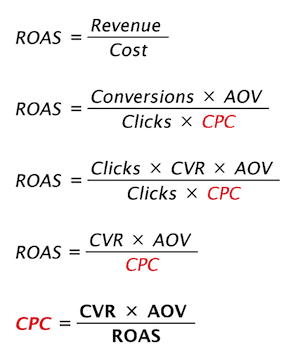
Similarly, if you’re optimizing for return on ad spend (ROAS), the formula is as follows:
Impression Share Estimates
Using historical data, we can estimate (note the key word here is estimate) what performance would be if we increased our impression share.
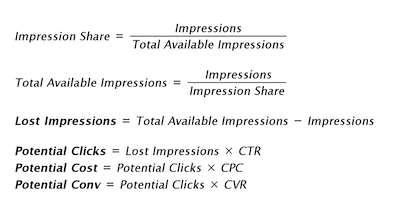
This is a simple model which can be improved by factoring in the different types of lost impression share. We can calculate some estimates if we assume that to decrease lost impression share due to rank, our bids will need to be increased.
![]()
Incremental Performance
To project the performance of incremental spend, we’ll stick with our previous impression share example. To calculate the incremental gains, we look at the estimated impressions, clicks, cost, and conversions of impressions that we gain by increasing budgets and bids. You’ll notice that this incremental traffic has a high ROAS. This is because we are only choosing to increase spend on top performing campaigns.
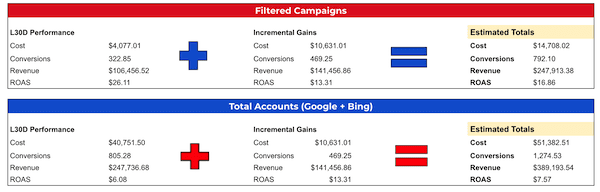
We add the incremental gains to the last 30 days performance to get estimated totals for the next 30 days.
Aggressiveness Ratio / % of Non-Converting Spend
Are you spending too much money on non-converting keywords? Are you only running on branded, high converting terms? Ideally, you have a good mix of higher funnel terms, as well as your bread and butter branded terms.
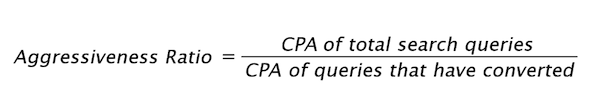
Luckily, you can calculate this number with just a few clicks in the ads interface. Navigate to the search terms report and grab the total CPA of all queries. Then simply add a filter for Conversions > 0. Divide these two numbers and voila!
Now we need to interpret the number. Here are some general guidelines:
1.0-1.5: The account is too conservative
1.5-2.0: The account is well-managed
2.0-2.5: The account is too aggressive
2.5+: The account is being mismanaged. Money is being wasted
Another approach is to look at percentage of non-converting cost.
Normalized Projections
Are you projecting performance for your PPC accounts regularly? If not, it might be a good idea to start!
To project how much we are going to spend for the month, we look at how much we’ve already spent (in blue) and then take our average daily spend over the last seven days, multiplied by how many days are left in the month (in red).

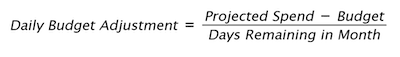
Now that you’ve got your projected spend, you can include an additional calculation that will give you the amount that you need to adjust your daily spend to hit your goal spend.
It’s as simple as that!
Closing
Hopefully this helps some PPC beginners get their bearings in regards to simple PPC math.
Need some tips for using Excel for your PPC tasks? Check out our Complete Guide to Using Excel.
