Today we have a guest post from one of our PPC Hero allies! Michael Wiegand is a PPC Guru & Google Analytics Consultant at Portent Interactive, a full-service internet marketing company based in Seattle, WA. In this post, Michael explains why Profit per Impression is the perfect metric for ad testing.
—————-
Ad split-testing is one of the core disciplines of PPC. If we don’t test, we can’t improve. And as paid search professionals, we become obsessed with finding the right combination of headline, call-to-action and destination URL to influence better account performance.
But there’s a problem with this discipline, especially from an e-commerce client’s point-of-view: Every impression shown on a poor performing ad is losing them money.
We assuage these fears by educating our clients on sample size, giving them regular updates on the progress of these ad tests. But maybe that isn’t the right approach.
Maybe the better approach is to change our testing metrics.
Calculating Profit per Impression
Striking a balance between Click-through Rate (CTR) and Conversion Rate (CR) optimization can be difficult. But if we knew how much Revenue was being generated every time an ad displayed and balanced that with Cost, that would be far more valuable.
That’s where Profit per Impression (PPI) comes in.
More accurately, PPI derives Profit per Thousand Impressions.
The formula for calculating PPI is:
Here at Portent, we use the ClickEquations bid management platform. Their “Text Ad Zoom” feature calculates PPI automatically:
But you can also calculate it manually using Google Analytics and Excel.
Go to Google Analytics. Drill down to Traffic Sources > AdWords:
Then, drill down to Campaign > Ad Group. Select Ad Content from the main dropdown:
Export this report as CSV for Excel:
 Once the data is in Excel, you can strip out all rows and columns except for the Impressions, Cost and Revenue, leaving you with something like this:
In the next column over, create a space for PPI and enter the following formula:
Once you’ve applied that formula, and changed your number format to “Accounting”, you can simply copy and paste it down to the cell(s) below to get PPI for the rest of your ads:
Using Profit per Impression
Now that we’ve arrived at our PPI metric, we can make better decisions with our split-tests.
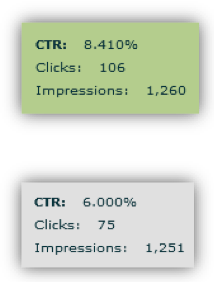
For example, take these two ads:
Both the Top Ad (A) and the Bottom Ad (B) have run on roughly the same amount of Impressions. A is the clear winner in terms of CTR. But that doesn’t factor in Conversions or CR.
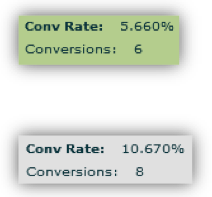
Now look at Conversions and CR for each ad:
B is the clear winner in terms of Conversion and CR. But that doesn’t factor in Cost or Revenue at all. The 6 Conversions on A might’ve brought in far more Revenue than the 8 Conversions on B. Furthermore, the 106 Clicks on A might’ve come at a lower Cost per Click than the 75 Clicks on B.
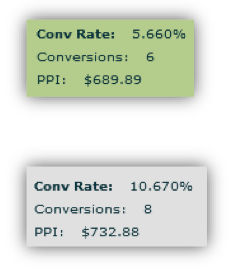
So let’s bring in PPI:
Low and behold, B takes the cake. It brings in approximately $43 more per thousand impressions shown.
Profit per Impression: The Perfect Metric
Instead of relying on purely CTR, CR, or even Revenue alone to make ad decisions, PPI leverages the only constant in your basic ad split-test – equal impression amounts – and it factors in what your client cares about most: ROI.
Take the guess work out of your ad testing, and use PPI.
—————-


