


We talk about testing. A lot. We talk about testing so much, you might think that all you need to do is simply create a test and you’ll be a PPC Hero yourself! Today we’re going to clarify how statistical significance is your key to proper testing and the true gateway towards being a PPC Hero.
Statistical significance, in manageable bite-sized terms, is the likelihood that the results you get from your test are going to keep occurring. Statistical significance can assure you that your results weren’t just chance, and there is an actual relationship between the winner of your test and the outcome you’re seeing.
Although you may be able to look at your data and say “Eh, I reckon she be a right winnin’ ad!” – there is a degree of assurance that comes with a quantitative process deeming that ad to be in fact a winner. Even though you see something increase (or decrease, depending on the metric), can you really call this one the winner? We know there are many factors that affect performance and using statistical significance of a winning test can at least narrow the validity of this assessment. You are able to reflect on the choices you’ve made on your client’s or boss’s behalf with the confidence only a mathematical formula can provide.
So, how do you find this magical number? There are countless calculators that allow you to simply input a few bits of data and in 0.2 seconds receive confirmation of your statistical significance. There are also more complicated calculators that ask for more data than the more rudimentary options. You are also able to create your own formula in Excel, but an easier source is provided by the Teasley calculator (a highly recommended tool for true statistical significance).
So let’s say you’re comfortable using a more basic option for determining the success of your test. Hot dog! Have we got the links for you! Like I mentioned, there are many free options for a simple calculation. If you are dubious of the true accuracy of the outcomes, Brad Libby certainly identified some of the common shortcomings of the widely used tools in this industry.
Before we launch into sample outcomes, let’s grab some data.
One example might be an ad test. When you pull the data from your ad test, you must first select your date range. Common best practice when conducting a test manually is to set yourself a timeline. Let’s take a look at an ad copy test I’ve been running for about 14 days.
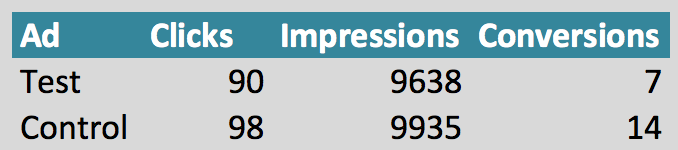
I then go to one of the free statistical significance calculators. After putting in my click results and conversion volume, I see:
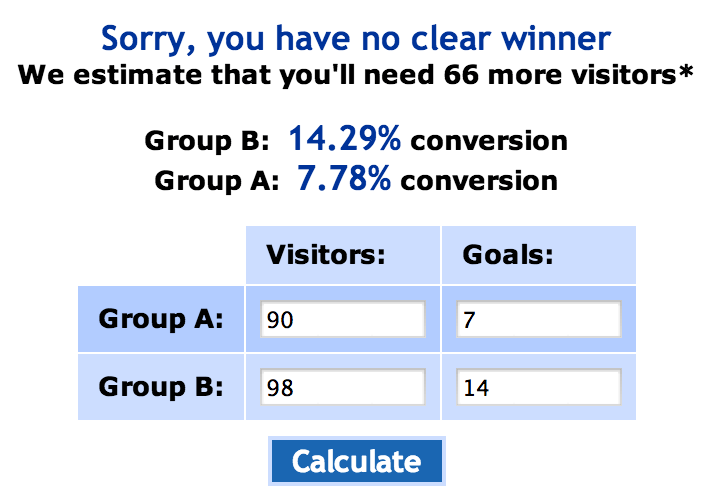
What?? No clear winner? My 188 clicks aren’t good enough??! In a word- NO. Although I can see that my Control ad brought in twice the leads, the volume of clicks we’re basing our assumptions off of just doesn’t give us full confidence that these results will continue once we’ve deemed the Test ad to be the big ol’ loser. It’s suggested that our sample size needs to be a bit larger to potentially yield a full-on winner.
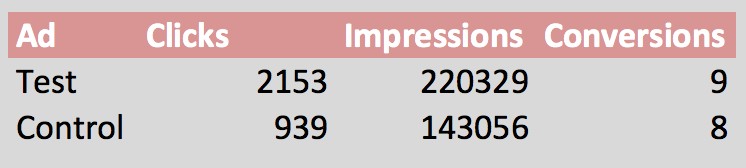
So let’s try it again. I’ve got a display ad test that I’ve been running for only a week or so and it’s only brought in 17 conversions total, but I see that my CTR is quite a bit higher for my Control ad, but my conversion volume is clearly lower. Let’s see about this test.
For this test we’ll use another quick & easy tool for finding statistical significance.
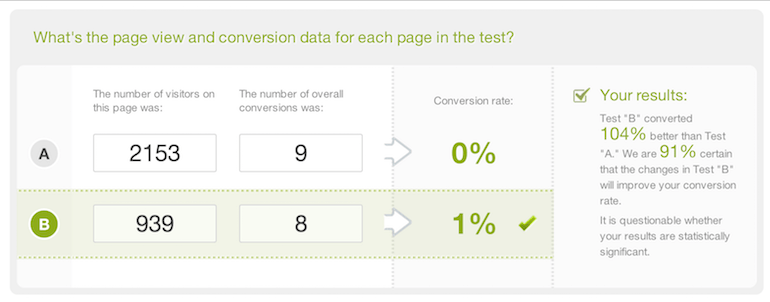
Here we’re told our results are 91% certain that my control ads will continue to perform at a better rate than the Test ads. While 91% sounds good, most of us are going to push for a 95% confidence or higher. This test probably stands to run a bit longer and re-try.
Another sample might be through a more thorough tool provided by Cardinal Path.
For this test, you input not only your click and conversion volume but your impression data as well. You’re also able to select the confidence you’re looking for. Here we’re aspiring to a solid 95%.
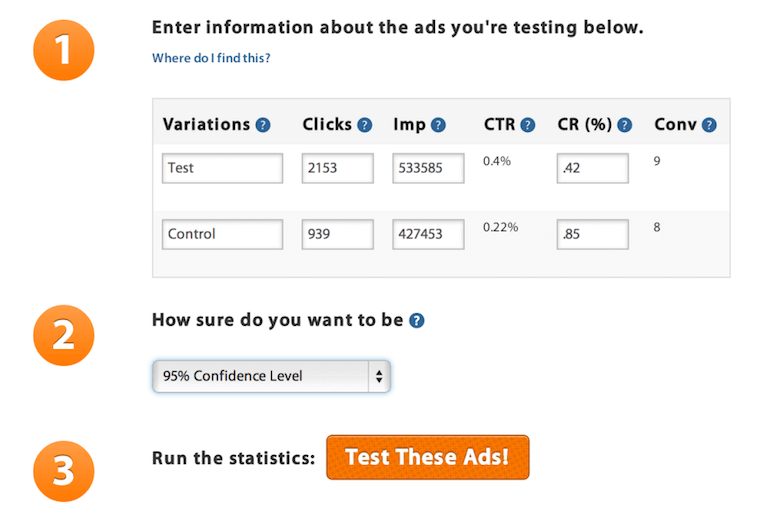
This gives you an analysis of the CTR and the conversion rate as indicators of statistical significance. For those who are simply seeking to build traffic flow to their site, the CTR details may be the most helpful, where many businesses will look to conversion rate.Upon running the test, we can get some light analysis of what we’ve got going for us. My results from Cardinal Path’s calculator:
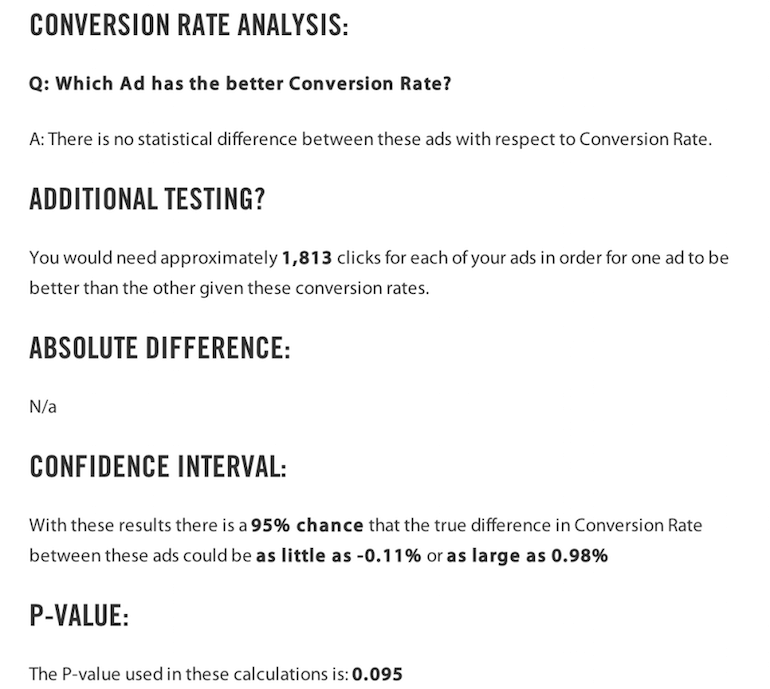
When looking at the conversion rate, Cardinal Path’s tool is telling us to hold our horses. Our data is not conclusive and there is not a statistically significant margin of performance between Ad A and Ad B.
So what do you do now?? You wrap your tests! Or at least, you check them for statistical significance so that you can present them to your client, your boss, or maybe just your mom with the confidence necessary to be a true PPC Hero!
