


One of the most underutilized AdWords tools is bid simulators. That isn’t to say they are unused as more often than not, users are simply skeptical. We’ve all seen the estimates for top of page bids and there is plenty of room for doubt. However, ignoring the tool completely means you aren’t taking advantages of potential areas for improvement.
What Is It?
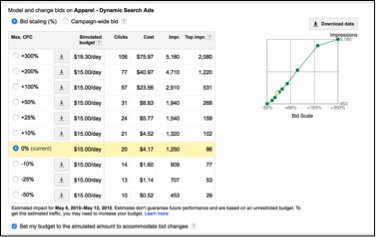
You’ve probably seen the simulations in the campaigns tab of your account. If you haven’t, click on the little graph icon next to your budget and you’ll see a pop-up with information on what would happen in the campaign at certain bid levels. You can find metrics for the three main campaign types: Search, Display, and Shopping. These simulations can be helpful for projecting performance at different bids and spend, if not precise.
Where does this data come from? Using the data from the previous 7 days worth of auctions, AdWords provides performance estimates at different levels. There are a few limitations though. If you’ve hit your budget cap you won’t receive estimates. If you don’t’ have much traffic you might just see impression estimates.
There is little reason to check these simulations on a daily basis, but it is worthwhile to look in from time to time. You might ask, “Surely Google has enough data beyond campaign estimates?” You are right – we have keyword data too, which is more practical and targeted than campaign level.
Keyword Estimates
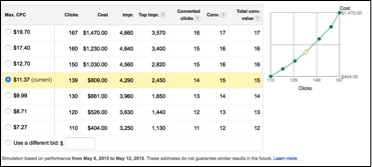
The keyword level gives more data and focuses on individual keywords rather than the entire contents of a campaign. These estimates are linked to the performance of an individual keyword in auctions. Similar to the campaign level metrics, availability is based on the amount of traffic. The higher the potential volume the more likely you’ll see the option available. For this reason, you may be disappointed to see less data on high-value exact matches and more data for broad match keywords with the potential to be triggered by more queries.
Just like the campaign estimates, you can click the graph icon next to the Max CPC and see estimates for different bids. This is more useful for finding breaking points. Many keywords will show a quick rise in clicks or impressions followed by a sudden flattening of the slope, showing where CPCs will continue to rise for little gain in impression share.
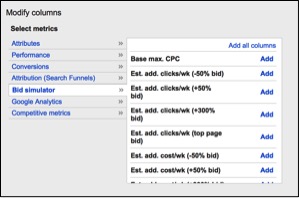
These graphs can be useful as going through your account, keyword by keyword, is tedious and time consuming. Looking at anything beyond a few keywords isn’t practical and does not deliver greater insights. Thankfully AdWords has columns for bid simulator metrics. Simply select your columns and add the appropriate ones from the bid simulator tab.
The one draw back here is that you only receive stock modifiers. Your choices are:
- -50%
- +50%
- +300%
- Top of page bid
These are not necessarily the most practical bid adjustments, but they at least point you in the right direction.
Making Use of the Additional Columns
Now that we have columns and the ability to see changes across keywords we can, you’ve guessed it, export to a spreadsheet. Go ahead and download your spreadsheet with the new columns.
Now you can sort by keywords that have data and examine them in bulk. The more powerful option is to combine these metrics with your current metrics to form better projections for potential changes.
Keep in mind that the estimates are based on and report 7 days worth of data. If you simply add the projected cost for a +300% bid to your last 30 days of data, you will be greatly underestimating the increase in spend over a full 30 days.
To balance this out you will either want to shrink down your actual metrics, estimate the average over any 7 days in the period, or expand your projections such as multiplying them by two to cover 14 days.
Digging In
Your keyword data now includes the metrics for changes in clicks and cost at the different bid levels. You can estimate how much your CPC increases for additional clicks, how much extra you need to budget over the coming period if you’d like to push on key terms. Clicks and spend don’t do much on their own though.
If you really want to leverage your insights, you’ll want to take a look at estimated conversions. This isn’t natively available in the projections but is easy enough to figure out with simple math.
To solve for estimated conversions, you can multiply the estimated clicks by the conversion rate to arrive at estimated conversions.
Which conversion rate you use is largely up to preference. If your data covers a longer range, you could potentially pull this off at the keyword level. The biggest issue here is that many keyword conversion rates are not close to what you’d expect over a large sample size. We’ve all seen low to middle volume keywords with great conversion rates over a short period of time, but these will always fall back towards the mean over the long run.
For this reason, you will have more luck abstracting your conversion rate away from the specific keyword, and working from the ad group, campaign, or account level conversion rate. It all depends on what you are most comfortable with and how greatly your conversion rate varies across different parts of the account. You can always use each of them to establish a range of possibilities. Note that we are making the assumption that conversion rates will remain steady against a higher or lower volume of clicks.
Besides calculating the total change, you can look at the performance of just the additional spend and conversions. Using these separately from the actual metrics can give you a better idea of what it costs for each additional click or conversion. This can be important to consider, as high CPAs for this additional traffic are an indicator you should be trying something else.
For example, if additional cost/additional conversions > (3 * Goals CPA), it might be a sign that you are going to be paying way too much above your target CPA for the chance at additional conversions. Of course, this is an option during certain periods but you will want to evaluate these options carefully to ensure you are pushing budgets at the correct time for your business needs. Either you’ll know you need conversions at any cost or your current CPA has to be low enough to absorb the increased cost.
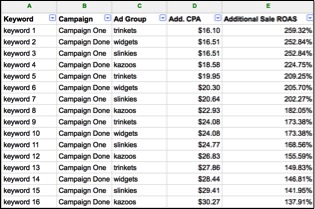
Long story short, don’t go in blindly. The best method is to calculate the metrics for anything applicable and start sorting into “potential winners” or “leave alones”. In the basic example below I’ve stripped down the columns to leave additional CPA and additional ROAS (estimating revenue by multiplying the estimated conversions by average order value).
Other Considerations
These estimates are a great way to calibrate your account. While you won’t use these every day they can be helpful when you need to make drastic changes to budgeting or your account is stagnant, allowing you to find ways to break through to new opportunities.
One major pitfall is that you rarely want to change bids by 300%. That is a recipe for disaster in most scenarios. Rather if you see increasing gains amongst the +50% and +300% it means there may be opportunities in expansion or increased aggression. You’ll want to slowly ramp up bids and stick with your current bidding strategies, but by moving in that direction you should expect increased gains.
You should also heavily consider the match type. You might be surprised to see you could triple traffic in an ad group by increasing your bids. This often occurs on very generic terms or broad match keywords. If this is the case, you might not find a surplus in value in all those extra clicks.
Bidding on broad terms produces more interesting search query reports but can be hard to justify the high spend and low conversions. Nonetheless, you could use this as justification for keyword expansion to find related terms with higher specificity.
