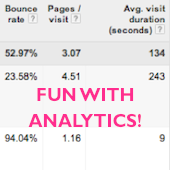
Judging your PPC Ads by Analytics Metrics

I thought I’d write a quick blog post as I’ve been working on some ad test results this morning and wanted to share a quick set of techniques for judging winners without conversion data. Most of the time we talk about either click-through rate or conversion rate as the key way we judge our ads. Here at Hanapin we combine the two and use IUC – impressions until conversion – as our key metric. Either way, the story is usually the same – clicks & conversions.
What do you do then if your account is predominantly focussed on generating calls and your call tracking software won’t go down to the ad level (mine is campaign level)? In this case your Google Analytics data is probably the best way to judge and there are three key metrics I use:
- Bounce Rate
- Average Pages per Visit
- Average Visit Duration
It seems pretty logical to assume that the ad with the best set of these stats probably generates the most calls. There will be a few cases where this doesn’t hold true, but generally it tends to work well (and has been shown to work by the increasing number of calls we’re getting).
Getting Analytics Data in your Account:
The first thing you’ll need to do if you haven’t already is link your Google AdWords and Google Analytics accounts. Here’s Google’s guide if you need help with this step.
Once that’s done you need to go back into your ‘my account’ settings and select ‘linked accounts’
Then select Linked Accounts -> Google Analytics
Finally, you should see something like this:
Once you’ve linked a profile with your AdWords account you’ll be able to start pulling Analytics stats into your AdWords interface. To see the data, first wait a couple of days for it to pull through, and then go to your Columns drop down and select Google Analytics:
There are currently 4 metrics you can include – Bounce Rate, Pages / Visit, Avg Visit Duration and % New Visits. My Ad report now includes these columns:
All sorted? Great.
Analyzing your Ads:
So now we have our Analytics data to look at I want to share with you a couple of quick tips for analyzing your data. The first is just to manually go through and select ads based upon the metrics you see in your AdWords GUI. However, if you want to be a bit cleverer and judge your ads over larger data sets, pivot tables are the way to go.
Go into AdWords and download your ad data. Make sure you set up the right date range – for accounts with lots of traffic this might be a week, for smaller accounts it could be a month or longer.
Once you open up your report you’re going to need to do add three new columns – which are ‘clicks * Analytics metric’ (see below). This is so that we can work out our averages correctly later on.
Once you’ve done this, create your pivot table by clicking anywhere in your set of data and then ‘Pivot Table’ – in my version of Excel it’s under ‘Data’ here:
I’m going to Pivot my Description Lines 1 & 2, but you can do it whichever way you prefer – Destination URL, Headline etc. – they should all generate some meaningful data for you.
Notice my bottom four tabs in the ‘Values’ section of my Pivot Table builder here – these are all manually added ‘calculated fields’.
This is where our earlier added columns come in handy.
To add each of my Analytics metrics into my Pivot Table I am creating a calculated field as shown above – ‘clicks * Analytics metric’ divided by clicks. In my tables I do the same for my 3 chosen Analytics metrics, and for CTR.
Here’s the results from the test I just pulled:
As you can see we have a pretty clear winner in Ad Copy 4. It won’t always be as clear as this, but it still helps you to make judgment calls beyond simply using CTR. If one of my ads had a great CTR but terrible Analytics metrics, I’d know the clicks I’m getting aren’t the ones I want.
Hopefully that helps you get started with using Analytics to judge your ad copy. Let me know if you have any thoughts or tips to share in the comments below!


