
Last week PPC Hero’s own Eric Couch detailed how to make display campaigns with higher quality traffic using category exclusions. On the back of his post I thought I’d set up a case study in one of my accounts and actually try to make higher quality display campaigns. How did I get on you ask? Read on…
What I did:
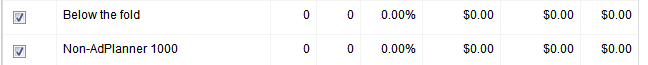
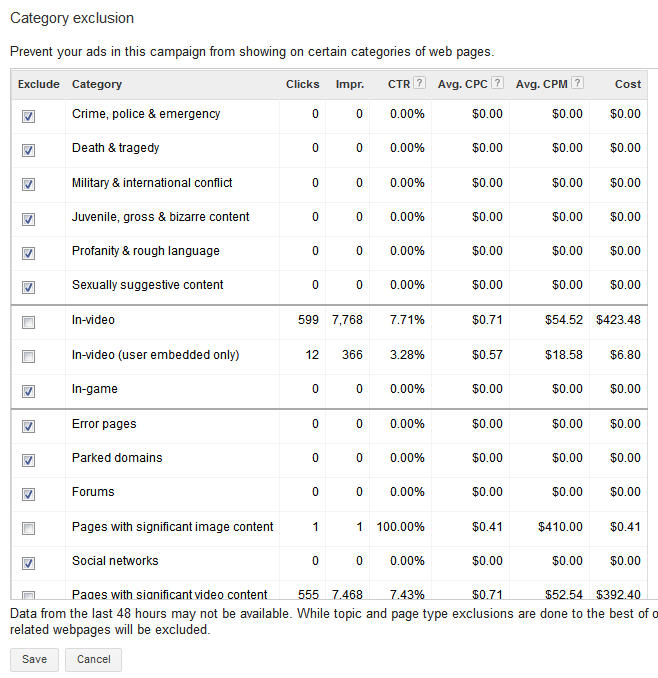
I won’t rehash old ground with a complete run down of how to set up category exclusions, but the essential premise of my test was to see if I could improve the quality of my display campaigns by appearing only on ‘Ad Planner 1000‘ sites and ‘Above the Fold‘.
My hypothesis was that first, ad planner 1000 would represent a higher quality audience (not strictly true), and that above the fold would mean that my impressions were more valuable even if my ads remained un-clicked.
For the record, selecting these two exclusions also forces a number of others on you (because they apply to both):
I also made sure to replicate the settings in my other display campaigns – there was no significant geographical, max CPC, text vs image ad changes in how this campaign was set up. Doing any of those things will mean you aren’t conducting a fair test. As my goal is to generate phone calls, my key metrics for determining success come from the Analytics tab in AdWords: Pages/Visit, Avg. Visit Duration and Bounce Rate. You can read a little more about using these stats to judge your experiments in a previous blog post.
So far this test has been running for two weeks and I thought I’d share a few of the results with you.
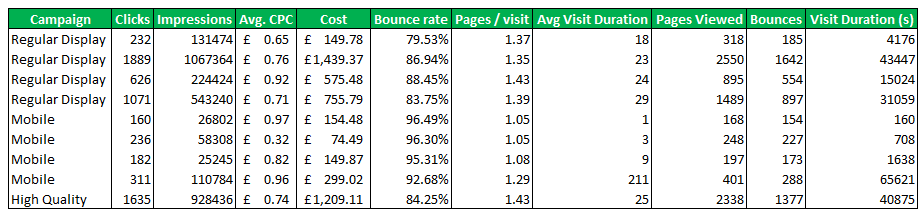
The takeaway from this so far are that of all my campaigns, the high quality experiment currently has the joint best Pages/Visit (1.43), the third best visit duration (25s) and the third best bounce rate (84.25%). Overall, there doesn’t seem to be a huge shift in quality, but it is noticeable that the traffic is slightly better.
I pulled this data into a quick pivot table to analyze the impact of my HQ display when compared with my regular display and mobile campaigns.
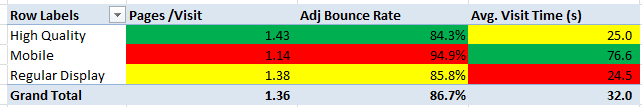
As you can see, the HQ campaign is faring well compared with the average of my other display campaigns – the only metric in which it isn’t best is the Avg. Time on Site and that is mainly because one or two visitors heavily skewed the numbers for the Mobile Display campaigns.
What we learned:
- High Quality display campaigns are slightly better than the average – although I am a little data limited in this conclusion.
- If you are severely budget limited with your display, you should definitely try this approach.
- You should test creating a high quality, category-excluded campaign in each of your accounts that run Display.
- If you have given up on Display, give this a go to see if it can generate conversions within your tolerance threshold (CPA).
Alternatives to my approach:
I tried looking at Ad Planner 1000 and above the fold placements, however there are plenty of alternatives in the category exclusions list for you to experiment with. A few to try might be:
- Error Pages
- Parked Domains
- Forums
- Sexually Suggestive Content (could this be damaging your brand?)
If you are able to set up an experiment, please let us know how it goes in the comments below!
