
We all know that paid ads appear above, to the right, and at the bottom of organic listings, and that the two most likely have an effect on each other. We also know that paid ads have the advantage of appearing at the top of the SERP, and we can easily measure performance by average position. In the PPC world we like to measure and analyze everything, but comparing organic stats vs. paid ad stats is commonly overlooked.
Whether you’re working on client accounts at an agency, or you’re in charge of your company’s digital marketing as a whole, it’s important to understand the relationship between paid advertising and organic listings.
Where to Get the Data
The Dimensions tab can be a great tool to slice and dice your AdWords data to recognize trends or optimize your account. If your AdWords account is linked to Webmaster Tools, you can grab the Paid & Organic report from the Dimensions tab.
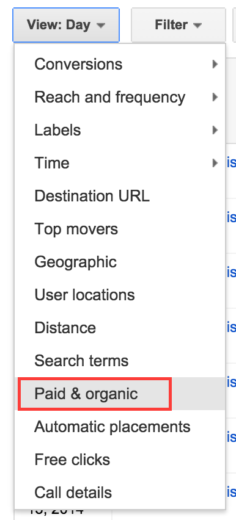
From here you’ll get a report that showcases paid and organic stats.
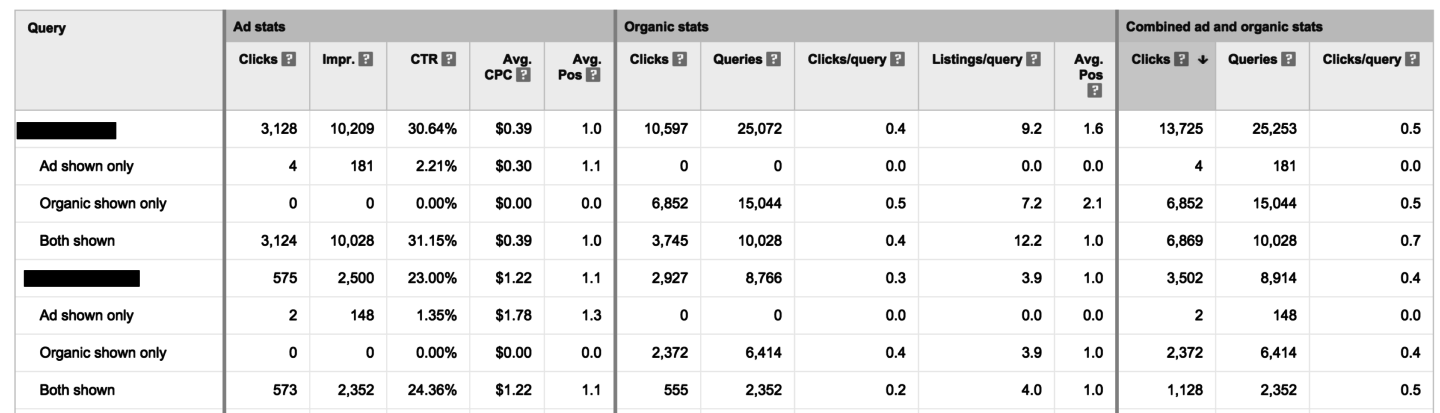
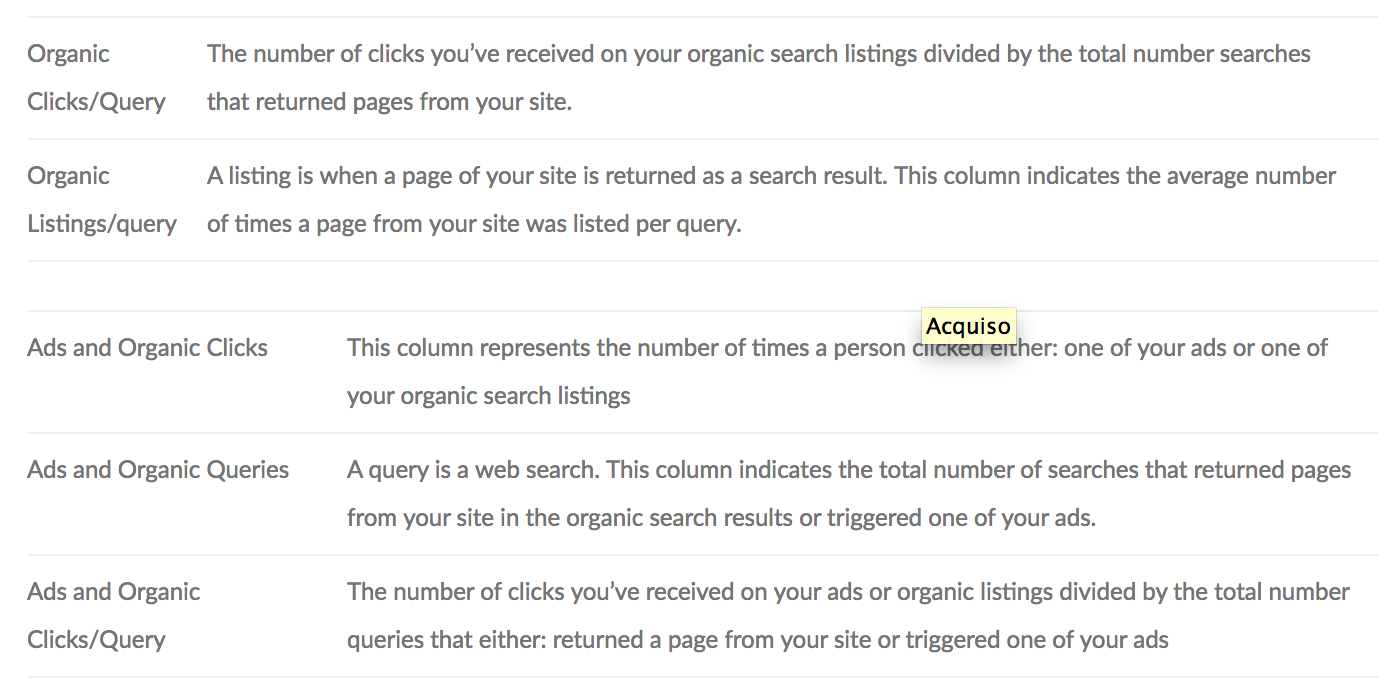
Here’s a quick overview of what some of these stats are (taken from Google’s support center):
While it’s great to review in the interface, the report doesn’t display its total value. Throwing the data into an Excel pivot table is when the magic starts to happen.
Analyzing the Data
Now we’ll open up our data in Excel to easier manipulate. Go ahead and download a spreadsheet of the data and get to pivoting:
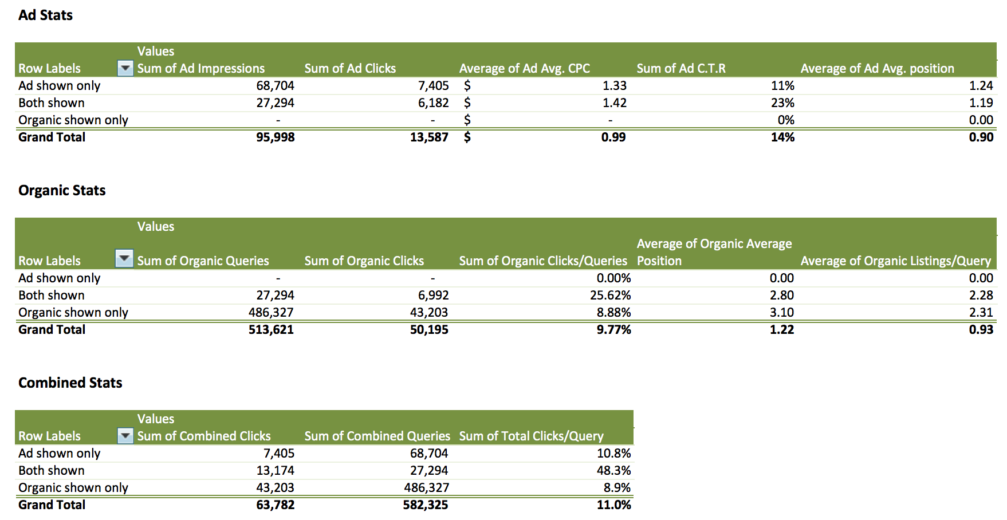
The results here are pretty staggering. Users are more likely to click on either your ad or your organic listing when both are present on the search engine results page.
What is the reason? Well, it’s most likely because users spend the most time looking at results towards the top of the page. Here is an interesting article about how users are viewing the SERPs. #4 on the list explains that while users are spending more time on the SERP and scrolling further down the page, having both paid and organic listings boost CTR, brand affinity, brand recognition, and purchase consideration. Research shows that “everything located above the top 4 organic listings (so, carousel results, knowledge graph, paid listings, local listings etc.) combined captured 84% of clicks.” Keep this in mind when you’re thinking about your digital marketing & PPC strategies.
Keyword Expansion
Another potential use for this report is for keyword research and expansion. Since we now know that performance is significantly impacted when both organic and paid ads show on the page, we want to look for areas where our organic listings are consistently showing without ads. We can control what ads and keywords we show for, whereas organic listings are a bit harder to optimize.
While in the Dimensions tab, simply set a filter to only show queries that resulted in 0 Ad Impressions:
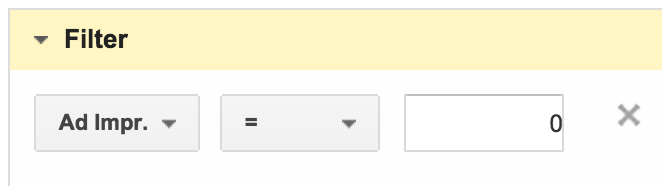
Now you’ll have a list of queries that are not currently triggering ads. Double check if you have these as keywords in your account, or if there are potential negatives blocking them. If you don’t already have these terms in your account, then you could be missing out on potential traffic; go ahead and add them (assuming they’re relevant, of course).
Conclusion
If you’re looking for new ideas for keyword expansion, or you’re just curious to see how paid and organic results interact with each other, the Paid & Organic report is interesting to look at. The benefits of having strong organic listings and being on top of your PPC game are substantial.
If your client hasn’t linked to Webmaster tools, refer to this support page about how to link the accounts.
