
Product Listing Ads have absolutely revolutionized how shoppers research and ultimately purchase products online. What started as an exclusive set of ads in the search engine results page has become a must have for any e-commerce advertiser. Google and Bing have both launched Shopping campaigns, which offer specialized segmentation and biding strategies for your PLAs.
If you haven’t yet started your PLAs, you’ve got some catching up to do. If you’ve created Shopping campaigns in Google but have yet to breach the Bing barrier, you’ve got a bit of work ahead of you, but most of your groundwork has been laid out.
When I considered setting up Bing PLAs, I had a lot of questions and a healthy dose of skepticism for what I could get in Bing and if it was worth the effort.
Let’s quickly go through a checklist of how to set up your Bing PLAs, in case, like me, you’re waiting for irrefutable evidence that yes, they will work and yes, you will see actual IMPRESSIONS and SALES from these ads.
- Merchant Center – Don’t be shy, it’s much easier than you think
- Product Feed – If you have this set up for Google already, they make it nice and easy for you
- Bing Universal Event Tracking – Do this. Like, yesterday.
- Campaigns (segmented or simply an initial All Products) – As you’ll see in today’s post, you may find the most success in methodically rolling out Shopping segmentation. You may have globally recognized top performers, but don’t just assume that breaking out a campaign in Google will guarantee equal performance in Bing. Be patient. Let the data come to you.
Now that you’re all set up, what now? When I created my first Bing Shopping campaign, I set bids slightly below those of my Google Shopping campaigns and waited. I wanted to see a few things:
Was the volume there?
Is the cost comparable to Google?
Do I see a similar CTR or Conversion Rate between Google & Bing when looking at the exact same products?
The reason I wanted to identify these performance results was to effectively allocate the right spend to the proper platform. If I’m selling products for various athletic brands, I want to see if Nike is as popular in Google as Bing. What about Puma? Or Skechers? We all know that the audiences between Bing and Google are commonly classified very differently, and I want to see if my PLA traffic tells me the same thing.
So I set up my campaigns, and I set them live with a healthy budget.
*No use in limiting volume with a meager budget and then complaining that “I don’t have enough traffic to determine much of anything.” Start strong, young Skywalker*
So now we get to go through my data and see exactly what happened. Quick notes for the skeptic: I chose to compare an All Products campaign, and then 3 Shopping campaigns based on top selling product brands
Total Volume Per Budget
For my All Products campaign, I saw both use the budget I provided them, although Google’s budget is quite a bit lower.
Why would I do this? Some of you might already have the answer to this: The budget for Google’s catch-all campaign is lower because there are many more Shopping campaigns broken out. This means fewer products are left to come through the All Products campaign. Bing, on the other hand, doesn’t have as much segmentation and thus the higher budget. Once I’ve identified more top performers within the All Product campaign, they’ll get their own budgets, too.
With equal daily budgets set for the product-specific shopping campaigns in Google and Bing, they spent them pretty equally. Across the boards, they spent within about 20% of each other.
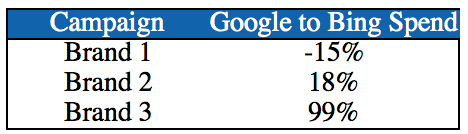
This was a surprise at first, as I’ve seen many a Bing SERP without any product ads. But by hook or by crook, these ads not only got impressions, but clicks, too!
Average CPCs
Average CPCs fluctuated much more than I had anticipated. In fact, I thought I knew just what would happen, and I’ll admit I was wrong. Although we initially set the bids for Bing at 75% of the Google bids, we employed our usual bidding strategy. We found that these ratios didn’t keep. As we optimized for clicks and sales, we saw Bing fluctuate based on the product brand.
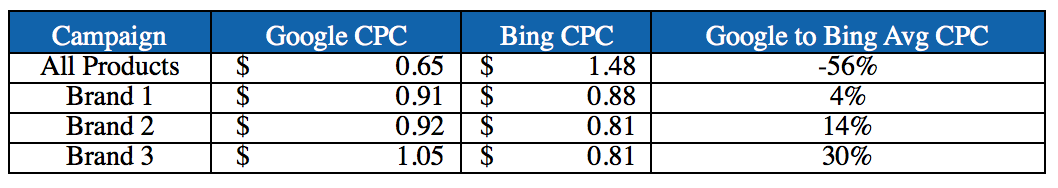
As we evaluate how our budget is allocated, these numbers help us determine how much traffic we’re missing. The All Products campaigns, for example, generates pretty different CPCs. Why would that be? Again, the lack of segmentation for Bing means that there are more dominant brands still contained within that are driving up the average CPC.
Imagine that someone knows they want a hip-hop CD versus the latest Common album. If I haven’t yet identified that Common is indeed a top-performing category, the competitive bidding necessary to keep his name in the top results will be higher. Although this doesn’t force my hand into segmenting the campaign quite yet, it does remind me that segmentation is absolutely necessary.
CTR for Similar Products
This is where things really got interesting. Going into this whole Bing PLA game, my biggest questions were based on the comparison of products and their relevance to those searching. Based on this data set and these particular product campaigns, the results varied widely.
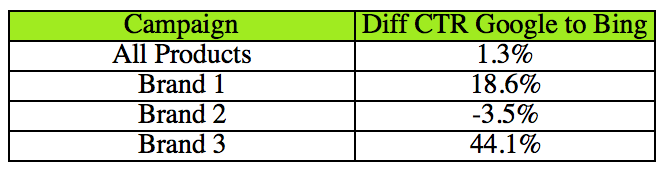
The biggest shock was the Brand 2 and Brand 3 distinctions. Brand 2 is a product brand that is generally speaking, our top performer. This is a household name that dominates our sales volume and is certainly the most competitive piece of our inventory. The fact that Bing actually had a higher CTR tells me that there’s a slice of the pie to be had in Bing. And if you’ll recall, this campaign also has an average CPC 12% lower than Google. Do I hear the makings of a customer acquisition? Yes I do.
Brand 3 also stands out, as it has a much stronger CTR in Google than Bing. This brand, while it’s a strong seller in our stores, seems to have either higher competition or just less competitive pricing than the other ads showing alongside ours. Either way, we definitely have some impression efficiency to build on with this Bing campaign.
Conv Rate for Similar Products
The second area of curiosity is the conversion rate associated with these campaigns. I know what’s getting the most efficient clicks, but what’s getting the most efficient sales?
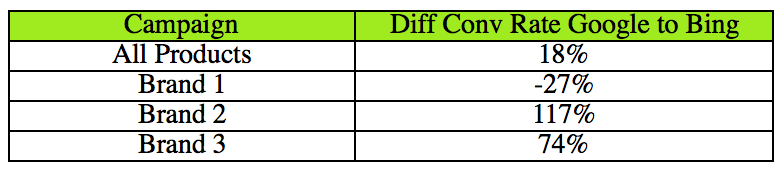
Youch. Looks like Google is absolutely dominating on a few of these brands, while Bing holds strong one of the four.
In fact, let’s go ahead and look at the true conversion rate data between these two publishers.
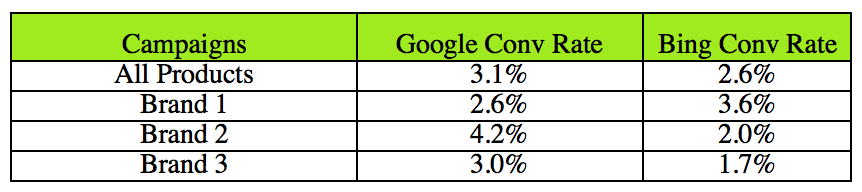
The good news? None of these have completely miserable conversion rates. And from this account’s history in the world of PLAs, it’s easy to get them to click, with our flashy images, impressive promotions and fantastic prices, but helping them find the specific version of the product to compel them to purchase can be a bit tricky.
Upon examining this data, I see that Brands 2 and 3 are just not getting the same results in Bing as in Google. Brand 1 seems to spend more in Bing, at a lower CPC but also a lower CTR. We aren’t as efficient about who we show our ads to, however, we do get them to buy once they’re on the site.
What does this tell me about Bing’s Brand 1 campaign? We’ll need to watch our quality score and account health when showing ads all nimbly bimbly, but if we can get them to click, we’re on our way. Contrastingly, we see that Brand 2 brings in a higher CTR at a lower CPC, but it doesn’t as often result in a sale. The question to ask ourselves is, why aren’t they making their purchase? Is our selection of this specific product type too narrow? The shopper clicks based on their expectation of what they’ll find, but they ultimately don’t connect with the right product?
This is my next step in optimizing these campaigns. Identifying the outliers in performance between Bing and Google. Clearly the audience is different and sometimes even the intent is different.
Bonus Data
When looking at the day-of-the-week performance, we saw a stark contrast in Friday vs Saturday behavior between Google and Bing.
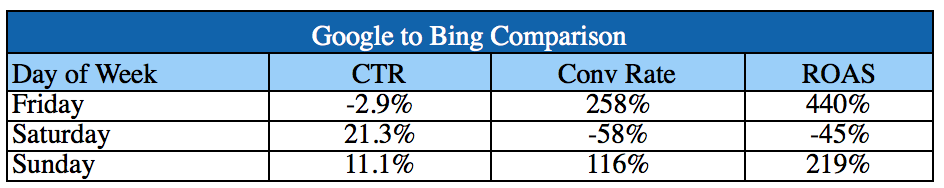
Interesting, huh? Both Friday and Saturday had within 50 clicks of each other for these Shopping campaigns, which means, it wasn’t entirely warped by volume.
On Friday, Google had 2.5x the conversion rate of Bing’s and a 4x greater ROAS. Yet on Saturday, Google might have had a 21% higher CTR, but lower overall conversion rate and ROAS. We can paint a quick portrait of our Google shopper versus the Bing shopper, deducing that more people are using Google to research and investigate on Saturday than Bing, where they’re ready to buy at this point. Bing’s average conversion rate for Saturdays is a whopping 7%, which gives us a lot to work with, especially within our top performing brands.
Segmenting your traffic never gets old and this quick day of week breakdown reveals a lot about the efficiencies within our top Shopping campaigns as they apply to Bing and Google.
What Did I Learn?
You can’t generalize your performance, especially between Publishers. As much as I’d love to set & forget my Shopping campaigns, the data reminds me that it’s just not going to perform the same and that’s life.
What successes and learning curves have you experienced when running Bing and Google PLAs? Does your data let you make sweeping generalizations (insert my envious face here) or do you find that certain aspects of your ecommerce account have wildly different outcomes?
