
 |
If you own an e-commerce site you know how important it is to get accurate reporting in order to manage your marketing programs. That’s why I use Google analytics. Google analytics is a free tool used for reporting on your site as a whole, not just on Google stats. It reports on all traffic sources, revenue sources, top landing pages, etc. But what I’d like to discuss today is the e-commerce reporting within Analytics, and how you can use it for your own e-commerce site to help improve your PPC account.
Using the Google Analytics e-commerce reporting tools allows me to determine where the majority of my revenue is coming from, what products my customers are buying, average order value, total number of web-based sales, and conversion rates and much more! From there I can make bid adjustments on keywords and revenue sources within my PPC account that are performing well or not so well. It’s a great way to improve your ROI.
There are three reports I use on a daily basis that help me manage my PPC account to get better results.
- Revenue by Medium
- Revenue by Product
- Revenue by Keyword
Top Revenue by Medium:
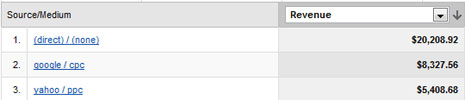
Medium is the actual source of the revenue. For example, medium could be Google organic, Yahoo PPC, direct or referral traffic. This report helps me determine which PPC account returns a better ROI for my client. If I find that Yahoo is spending less and generating more revenue, then I can shift my budget more towards Yahoo in hopes of increasing revenue via PPC. The report is also great in determining what percentage of revenue the PPC accounts attribute to overall revenue. This is a great selling point to my clients. If I can tell a client that pay-per-click has attributed 60% of their sites overall revenue that is a great stat to report!
Revenue by Products:
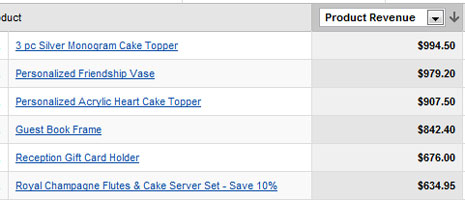
The revenue by products report helps me determine in any given time frame which products are generating the most revenue. The report shows revenue for each product, the amount of that product that has been purchased, how many transaction took place, average order value for each transaction for a particular product, and more.
What’s cool is that I can determine how much I am spending on the keywords for these products and compare that to the revenue they’re bringing in to determine the ROI. If a product is a consistent top seller then I will increase my keyword bids for that product in hopes of generating more traffic. It also works in the opposite way, if there is a product that I’m really trying to promote but find I’m spending way more than what it’s generating in revenue, this allows me to lower my keyword bids for that product and spend my PPC budget on something that is converting well.
Revenue by Keyword Report:
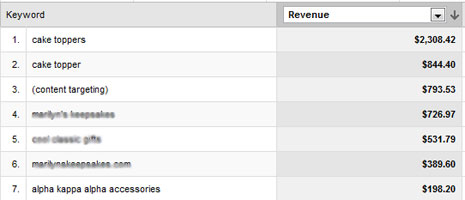
Revenue by keyword report is identical to the revenue by products report. While the revenue by products report shows actual products that were purchased, the revenue by keyword report shows the actual keyword that generated the sale. This is, of course, great for adjusting keyword bids that are not generating a great ROI.
Again, just like that of the revenue by products report, I can determine my top performing keywords by revenue and continue increasing those keyword bids while lowering any non-revenue generating keywords all the same. This helps your PPC conversion rates and will help increase your PPC ROI.
Now that you know a thing or two about the Google analytics e-commerce reporting, you may be asking how to set up E-commerce tracking for my website. If you have a programmer setting up the e-commerce tracking is rather simple. Just follow the instructions from the Google help section.
The best reason for having analytics is that it can give you great insight into how your account has performed over time. If there are certain products or keywords that always generate a high ROI then you know to keep those in your PPC account. There are many other reports in the e-commerce section of Google Analytics that can help increase your performance in your PPC account. It may just take a little time browsing through the reports and finding something that’s helpful or insightful to you.
