
Search Query Reports (SQRs) can be overwhelming. Downloading all of your keywords and scouring through the data associated with EVERY word in the hopes of stumbling upon one or two significant findings that MIGHT incrementally improve your account seems:
- Overwhelming – because where do you start?
- Not worth the time. How often are you really going to find something worthwhile at such a granular level?

I have a tendency to get lost in the details of an account, so I have asked myself both of these questions and I imagine some of you have too. In this post, I am going to show you that it does not have to be overwhelming because it does not have to take more than ten minutes.
How? EXCEL PIVOT TABLES. If you are not already using pivot tables to analyze other data in your account, now is the time to start. I am not going to say that pivot tables solve all data analysis problems, but I believe in pivoting as strongly as Ross in Friends.

Now, where should you start?
That depends. Classic PPC response. I know, but it’s true. But one thing is for sure, no matter the account, Excel works faster with less data. So determine an area of your account where you want to optimize at the keyword level. Ask yourself questions like:
- Do you have an ad group that is far from meeting CPL goals?
- Do you have a campaign that is not meeting ROAS goals?
- Is there extra budget available for one campaign that rarely spends the full budget as is (meaning you need some keyword expansion)?
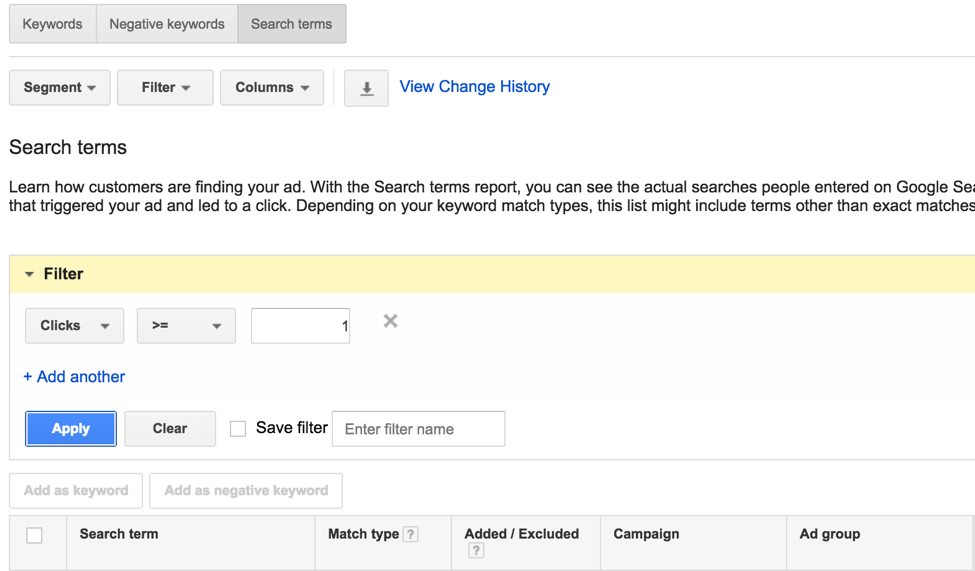
If you can identify one part of your account that you’d like to focus on, Excel will thank you later. Now go to your account keywords and review the search terms. If you really want to take a look at your keywords from an account-wide perspective, that’s okay. However, if your account has thousands of keywords, you should use the filter in the AdWords interface to filter out search terms with 0 clicks.
Next, make sure you have all the columns you need. In my experience, and for the recommendations I’ll make in this blog, you will need the following columns:
- Search Term
- Match Type
- Added/Excluded
- Campaign
- Ad Group
- Keyword
- Conversions or converted clicks
- Cost
- Total conversion value (for Ecommerce accounts)
It’s time to download!
Now, back to your purpose for doing this exercise in the first place. Do you want to expand upon a campaign or ad group? Decrease spend? Below, I’ve broken up my SQR pivot methods by purpose: Keyword Expansion or Decrease Spend.
Keyword Expansion
The most common reason for keyword expansion is to find new customers, so this strategy is specifically focused on non-brand campaigns.
If brand terms are spread throughout various campaigns or ad groups, use the following steps to assign “Brand” or “Non-Brand” to each campaign or ad group.
- Select any one of the headers for the raw data and then click the “Sort & Filter” drop down. Choose “Filter”
- Add a column to your data sheet and make the header “Brand or Non-Brand”
- Based on your account structure, filter campaigns or ad groups to find all of the keywords that are considered “Brand” terms
- Type “Brand” in the first search term row and copy that down the column for all Brand terms
- Remove the campaign or ad group filter when complete
- Filter the “Brand or Non-Brand” column for “blanks”
- Label those search terms/keywords as “Non-Brand”
Search Terms That Generate Revenue Or Leads
- Start with filters
- Match Type – Filter for only broad matches
- Campaign – If you’ve chosen to do an account-wide SQR, remove non-brand campaigns OR if you used the steps listed above to create a “Brand or Non-Brand” column, filter to exclude “Brand”
- Insert “Search Term” in the Rows portion of the pivot table builder
- Insert “Impressions”, “Cost” and “Total Conversion Value” in the Values portion of the pivot table builder
- CPL or ROAS column – depending on company goals
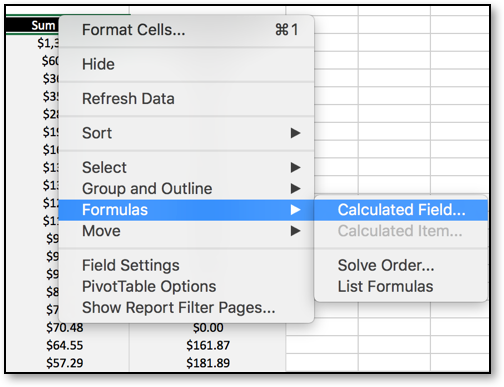
- Right click on your pivot table, choose Formulas – Calculated Field
- In the Name field, type either ROAS or CPL
- In the Formula field, insert Total Conv. Value/Cost or Cost/Conversion (Do not use the pre-calculated field from AdWords called “Cost/Conv”)
- Click Add, then OK
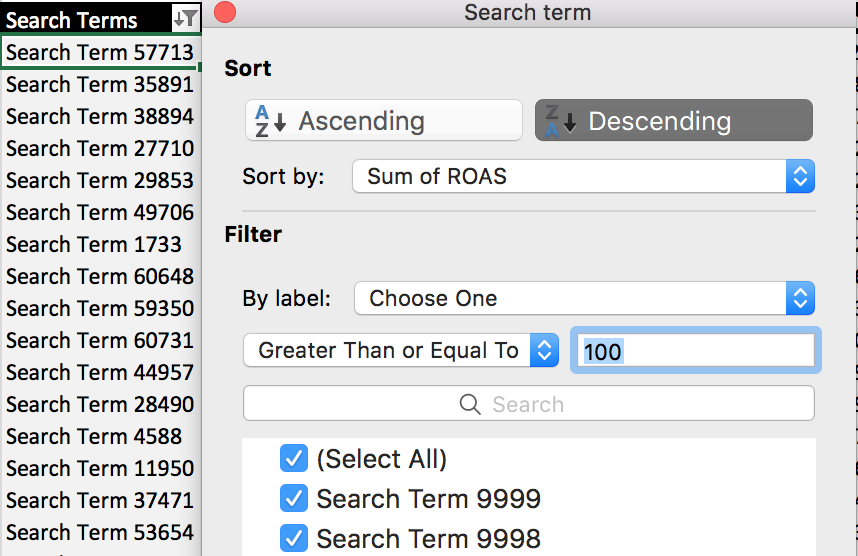
5. To remove Search Terms with very little traffic, it’s easiest to filter by impressions that surpass a certain threshold, say 100. This can be done using the filter next to the “Row Labels” cell (which I have already relabeled in the image below to read “Search Terms”.
- After formatting, your pivot table should resemble the table below.
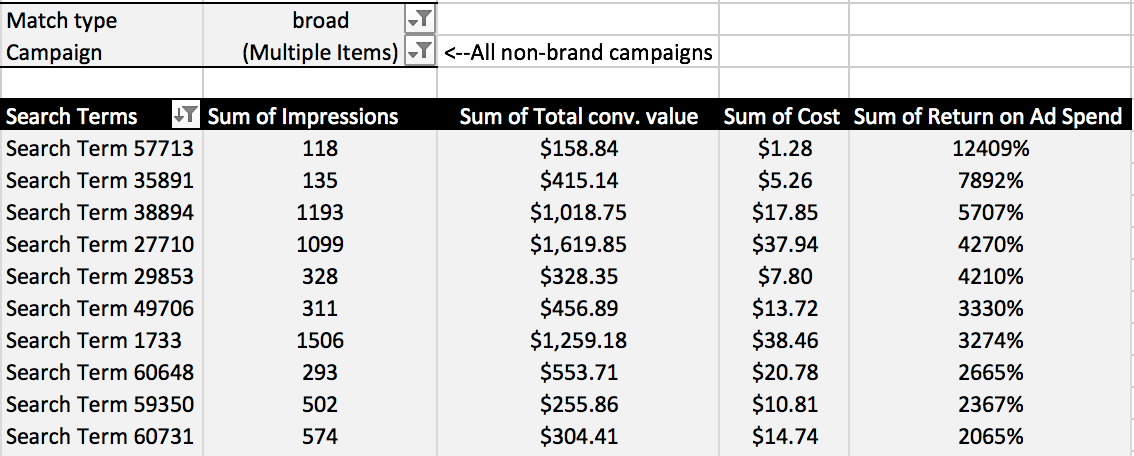
It’s evident that there are several search terms in this account with incredible ROAS. This data comes from a client in a very niche industry, so it’s not uncommon to see ROAS this large. CPCs are low and average order value is high. These are the terms that might be worth adding as exact match keywords to the account.
Eliminate Wasted Spend
Every account should run search query reports in order to identify keywords or search terms that are wasting spend. Of course, “wasted spend” is always dependent on advertising goals, so the definition of “wasted spend” varies. In this example, the assumption is that non-converting keywords are generating “wasted spend”. (Some companies use Search advertising for brand awareness, so one of their goals is just to appear in as many relevant auctions as possible so consumers recognize their brand. These SQRs do not apply to those situations). Below are three different pivot tables that can be used to eliminate wasted spend.
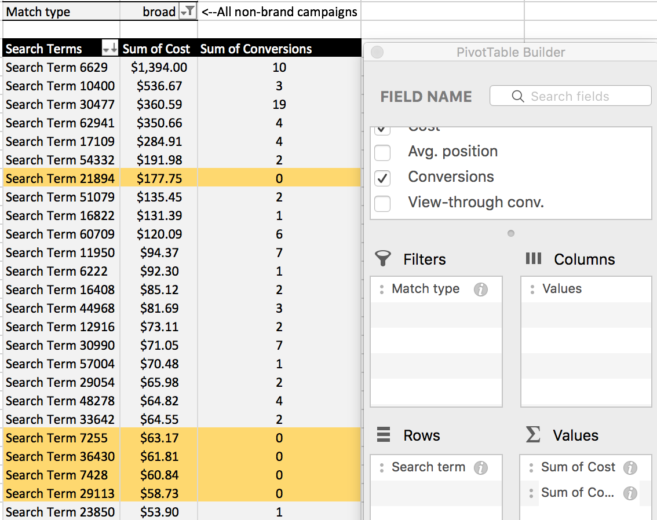
Search Terms That Spend But Do Not Convert
- Start with filters
- Add Match Type – Filter for only broad matches
- Add Search Term for the Rows
- Add Cost and Conversions for the Values
- Sort the Search Terms – Descending by Cost
This list of search terms should be used to update the negative keyword list for the respective account, campaign, or ad group.
Final Thoughts
Pivot tables can save you loads of time, especially when it comes to Search Query Reports. The main questions you need to ask yourself before creating a SQR pivot are:
- What does the account need overall? Expansion opportunities or decreased spend?
- Is there a particular area of the account that would benefit the most from an SQR?
The answers to those two questions, along with the technical lessons from this blog, will make your SQRs more efficient and effective.
I’m interested in hearing any other kinds of SQRs you create with pivot tables. Please tweet to myself or PPC Hero.
