
Account Managers don’t always see behind the curtain to the CMO controlling their budget and helping set their goals. But they can arm their contact/boss and the CMO of the client/company with metrics to help them set priorities, budgets and the targets which they will be measured against.
One common mistake that account managers make is only focusing on lagging indicators of success; otherwise known as CPA, lead volume, sales, ROAS, etc. Often CMO’s are more interested in the leading indicators; such as impressions, CTR, and how additional budgets would be spent.
The following are 6 quick metrics that empower CMO with the information she needs to get things done.
Available Impressions for a Topic
The CMO charged with expanding the brand will like the big numbers and tell the CFO that this is the place to spend the money.
To get this statistic go into an ad group and then go in the “Display Network” tab, then the “Topics” sub tab, and click “change display targeting”. Then pick what every topic/sub topic you want. The available impressions will show on the right.

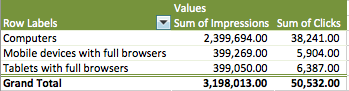
Impressions by Device Type
IT has a lot of people adding to their task list. But if the CMO knows how many impressions/clicks are being driven to tablets and mobile devices, mobile optimized sites may get shifted to the top of that list.
Download a keyword list and segment it by device. Then you run a pivot table with device type as the row and impressions, clicks, spend, conversions as the values. Then you can show the CMO how much inventory is out there by device.
Impression Share (AKA look at all these leads you’re giving your competition)
How many leads are you missing just by capping budget? Or even, how much are losing by not affording to pay as much for clicks as the other guys? This information arms the CMO with insights into where to spend dollars and perhaps adjust CPA targets.
You can pull impression share data out of the Google interface and have to run a report for Bing. Both will tell you what percentage of the time you showing compared to how often you could show if you were not limited by budget and/or had higher ad rank (bid X quality score).
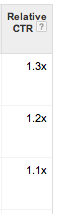
Relative CTR
Need new display ads? Showing the relative CTR of ads can demonstrate the weakness of the current assets and help get quick approval. If your CTR is good you can brag, if your CTR is bad then you know you have some work to do. This includes cleaning up your placements, tightening your targeting and testing new ad creative.
This one is easy! You can simply add the column (under Competitive metrics in the column view selector) and your relative CTR (available for display campaigns only) will show. A 1 or greater means you have a higher CTR than your competition, below 1 means that you have a worse CTR.
CTR by Campaign Type
This metric is important if a company sells a lot of products or services as it shows a general indicator of demand for that product and/or how compelling the company’s product offering is in the vertical compared to its competitors.
This one is simple, just download a campaign report (if you use labels to define what your campaigns our download this too) and either use campaign labels or add a column and define your campaign types (brand, competitor, product a, product b, etc.) Then create a bar chart with CTR by campaign type.
Necessary CVR for Hitting CPA Target
People who do not have access to the information they need to set the right goals and sometimes the person who is in charge of setting them. Understanding CPC for a campaign tells you what conversion rate has to be in order to hit a target. This information can help determine the plausibility of a goal
Average CPC / Target CPA= Required Conversion Rate to hit goal
Ex: $2.25cpc / $44cpa = 5.1%required conversion rate
Those are 6 easy to find/easy to explain metrics that I find help inform CMO’s and other marketing executives of where to focus their attention and marketing dollars.
