

Google Analytics is unquestionably a great resource for your PPC efforts. That being said, it is also chock full of data and statistics. If you aren’t careful, you can end up spending long periods of time within Analytics, plugging away to get the relevant information that you so desire.
However, Google recently released a beta of Custom Reporting, which allows you to quickly and easily plug the metrics (typically numbers or values) and dimensions (typically text, i.e. region or language) of your Google Analytics account into a simple interface that will quickly provide you with the data you need. These reports are then saved to the main dashboard of the Analytics interface and can be accessed at any time, quickly and easily.
Why should you care about Custom Reporting? Custom Reporting can better serve you, your coworkers, and your clients, all in one fell swoop. Use Custom Reporting to create custom reports for other notable stakeholders in your account. For example, if the main contact for your client is only interested in a few things, and doesn’t care about all the other goodies that Analytics has to offer, you can easily tailor a simpler custom report for that occasion. On the flip side, you can create a custom report for yourself and your colleagues that make use of the sub-dimension functions to drill down five levels deep.
Therefore, it is now easier than ever to analyze and break down the nitty-gritty of your users’ behavior, better optimizing your search engine marketing efforts as well. Needless to say, Custom Reports are great in a variety of ways, and however you slice it they will save you time and effort within the Analytics interface.
The Google Analytics help section has a very helpful (go figure!) illustration that breaks down how to create a custom report:
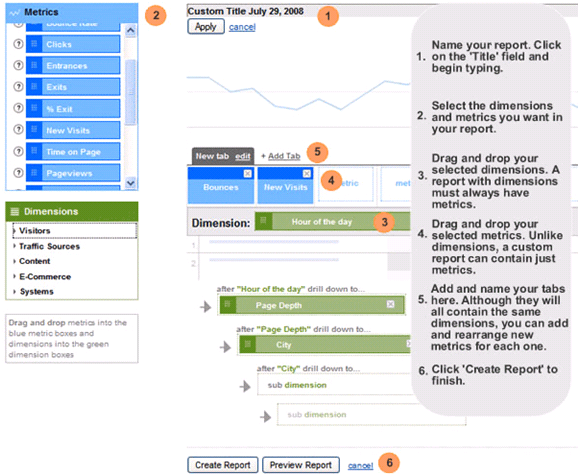
Take a look at the image above to see how to use Custom Reporting. Or, this video, also provided courtesy of Google, also has some great instructions.
As you can see, Custom Reporting allows for lots of drag and dropping, lots of metrics and dimensions to choose from, and the aforementioned drill down sub-dimensions. There are some limitations within this drag and drop framework, as only certain combinations of metrics and dimensions are allowed together. You could take a look at the combination matrix provided by Google, or figure it out yourself since unacceptable combinations aren’t drag and droppable in Analytics. Either way is fine with me.
I’ve wasted enough of your valuable time with this post. Go get some of it back by incorporating Custom Reporting into your Google Analytics accounts!
