

As part of our local PPC blog series, today I’d like to discuss geographic performance reporting. Running the proper reports within Google AdWords and Google Analytics can pave the way to geo-targeted success! You may already know where you locally targeted PPC ads should appear, then you’re ahead of the game. But suppose you want to discover where your ads are “hot” and where they are “not.” There are a few reports that will help you get this information.
First, why do you want to run these reports. If you are currently running a nationally focused campaign and you want to get more granular with your targeting, these reports can help you learn in which country/state/province/city you may want to target your ads. Also, you may discover that there are specific areas that don’t convert well at all. You can exclude these locations from your PPC distribution.
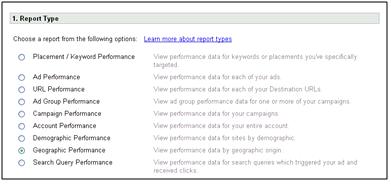
Let’s review the AdWords Geographic Performance report first. Within the reporting tab, you’ll see the Geographic Performance report option (highlighted below):

This is the report you’ll run to get your geographic performance data. Next, you’ll want to adjust your advanced settings. Do you want data at the country/territory, Region, Metro or City Level? Or all of them? (Highlighed below):

Within your advanced settings you’ll also want to select all of the appropriate conversion data as well. This report is extremely helpful and will allow you to gain insight into your where your ads are performing best.
However, there is one gripe I have with this report. And it’s a big one. You can run the geographic performance with only a daily time frame. This means I can’t get the information in summary. If I want to know how multiple campaigns are performing on the west coast, I need to run this report and then aggregate the information together because it is served to me in daily doses. I just want to know for the past 60 days how may ads have faired on the west coast… but I’ll have to added up all the stats. Takes up time and it’s a hassle. Big thumbs down on that.
You also acquire geographic performance data from Google Analytics. To find this information, I prefer to use the new Custom Reporting feature as seen below:

To create a custom report you need to chose from two lists: metrics and dimensions. As you can see below, the metrics I have chosen are “new visits” and “goal1 completions.” This data will be broken down by Country/Territory, Region and City. And it’s just that easy! You will need to have goals set up within Google Analytics to pull this kind of report.

These are two methods for which you can pull your geographic performance. Once you have pulled the proper reports, then you can get to analyze this data to determine where you should focus your geo-targeting efforts. Happy reporting!
