
There are many reasons a new PPC account will land in your lap, including:
- Transitions within your agency.
- Taking over an account from a prior agency.
- Starting a new in-house position.
If you are anything like me, you will look at said new account and say “where do I begin?” In this post, I will discuss my methods for getting a good grip on new accounts.
Quality Score Analysis With Impression Share
At Hanapin, we often talk about best or common practices. And we definitely have our own Hanapin way of organizing accounts, as I’m sure many of you do as well. So when I get a new account, I have to resist the urge to just dive in and re-do everything so it matches the rest of my work. I have to take a step back and follow the data.
In a previous post, I have talked about running a report for weighted Quality Score and Impression Share. In the example I used, it was clear a restructure was needed. But that isn’t always going to be the case. So what do you do when the structure, though not up to your standards, isn’t in need of a redo?
In the below example, despite the account being structured in a way that makes me cringe, the quality score is in great shape. However, impression share is just about as bad as it gets. Instead of the data confirming I need to restructure, it is showing me that something is amok with the bidding strategy.
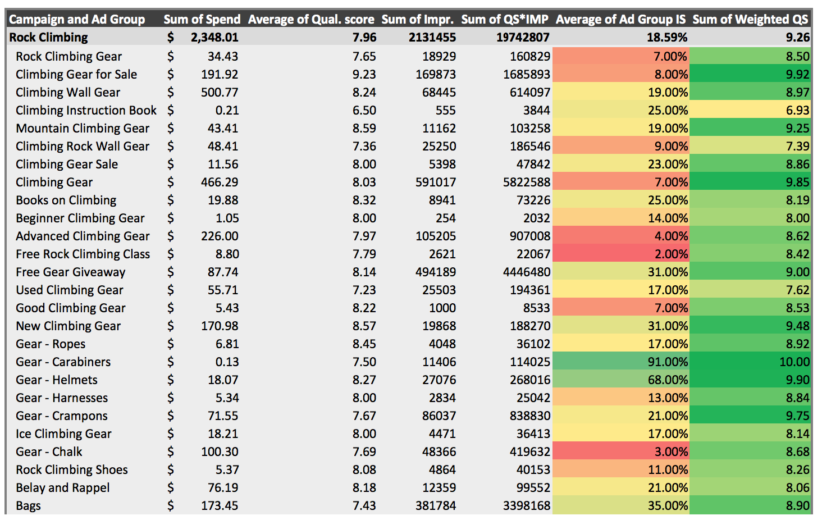
Takeaway: Let the keywords live where they are and focus on the bids instead.
Cross Pollution And The Aggressiveness Scale
The next pair of reports I run deal with keyword strategy as well. This time around, we will be pulling a search query report to help us get a strategy in place.
While the QS with IS analysis may show you the account structure is in decent shape, the Cross Pollution report will show you if your negative strategy makes sense and is funneling traffic to the correct place. Pull a search query report depending on the volume of traffic to your account (I like to pull at least past 3 months).
Once you have the report open, pivot the data so your search terms are your rows and the count of keywords your values.
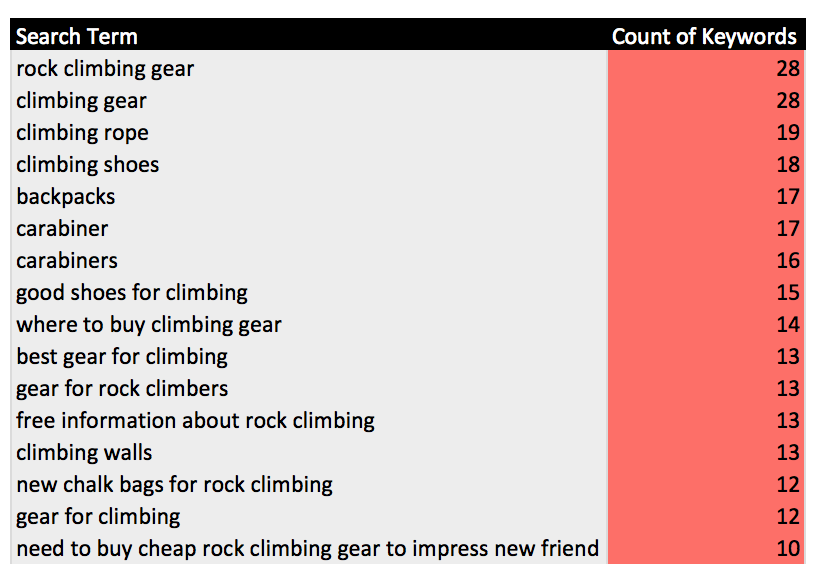
Search terms matching to too many keywords is a no-no. It can cause wasted spend and keyword/ad congruency issues to name a few. The above example illustrates that while from a quality score standpoint, the structure is in decent shape, the negative keyword strategy is not strong enough or just not present. At this point in your analysis, you can decide to focus on building plenty of negatives both at campaign and ad group level or rethink the ad group structures.
Since you have the SQR up and open, go ahead and check the aggressiveness of your keyword strategy. To calculate your aggressiveness, take the CPA of all search terms divided by the CPA of converting search terms only. Here is your key to the aggressiveness scale:
- 1 -1.5 = The account is too conservative, and likely missing out on a great deal of available traffic.
- 1.5 – 2 = The account is well-managed with a mix between proven winning keywords and some exploratory keywords to capture new traffic.
- 2 – 2.5 = The account is too aggressive and is spending too much on keywords that are capturing non-converting search queries.
- 5+ = The account is mismanaged, and wasting a large percentage of its spend daily.
In the example below, you can see the account is too conservative.
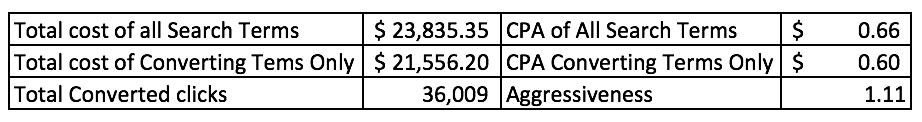
Takeaways: Make your negative strategy do more than keep away bad traffic and put keyword expansion at the top of your list of items to tackle.
Competitive Analysis
Next on my list: competitive analysis. I recommend watching this or reading this if you need solid footing on everything auction insights. Why do I run competitive analysis? I find a lot of times the competitor names provided by clients or account managers vary greatly from the actual competitors revealed in auction insights.
Running this analysis tells me one of three things:
- Our named competitors align perfectly with data in the report.
- Our named competitors are different than what the data reveals, but still in the same vertical.
- Our named competitors are vastly different than what the data reveals and does not make sense.
With outcome number 2 or 3, this tells me that we aren’t bidding on the right types of keywords.
Takeaway: Know your competitors.
Device Performance By Location
Performance analysis by device is quick and easy but really insightful when getting your hands on a new account. Once again, it is about uncovering the truth in data and aligning it with what you think you know about the account. I like to pull device reports with location segments as this data tells me how people are searching where.

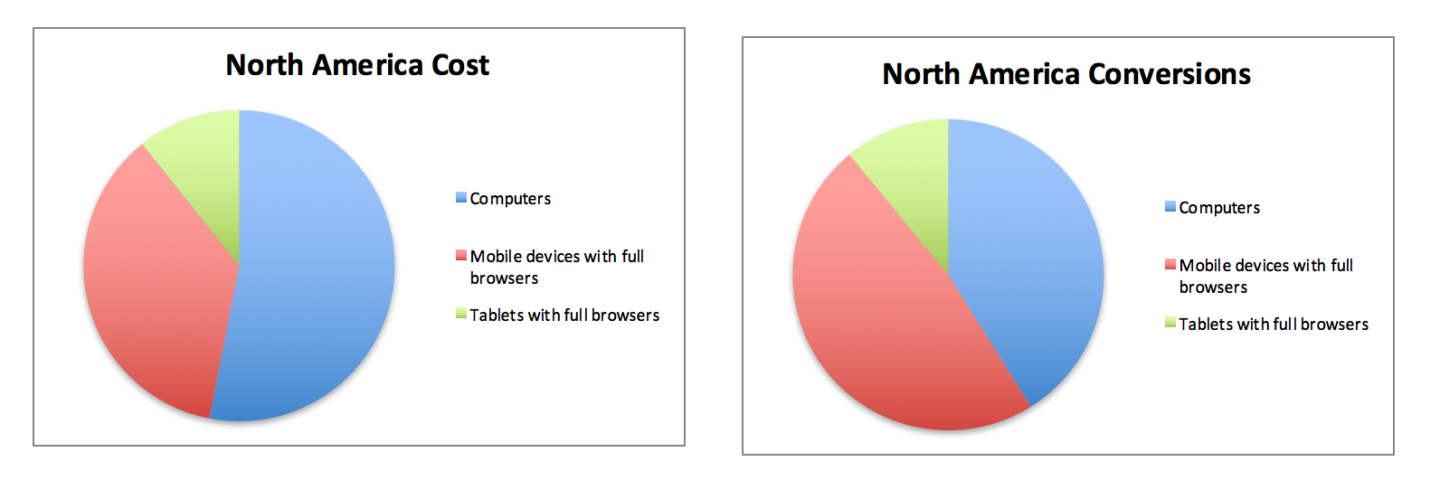
Takeaway: Make sure your mobile bid strategy is on point.
Ads
Lastly, I look at the ad copy. I’m not looking for what works in the text and what doesn’t quite yet. I’m looking for two simple things to get started:
- Do we have mobile ads running in each ad group?
- Do we have no more than 4 ads per ad group (2 all device and 2 mobile)?
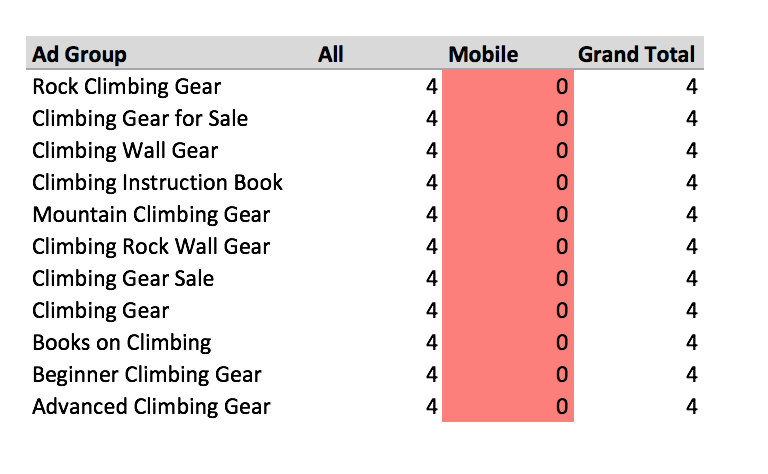
Takeaway: Get ad counts cleaned up now rather than waiting until you want to start your creative testing cycles. It makes it a much smoother process.
Getting To The Top
It can often feel like a slow, painful process to get a new account and take it to the next level. It doesn’t have to be. Getting a good grip on what is going on in the account from the start will help set the pace for management. Just remember to use your tools, take your time, and always come to PPC Hero for help if you need it.
