
Today’s post comes from PPC Hero Ally, Tyler Jordan of PPC Associates.
—
Think about remarketing like a recipe: it’s a best practice, but you don’t have to follow it to the letter; you can shape it to your tastes. You like your chicken spicy? Put some cayenne in it. If your funnel doesn’t match the one I’m about to show you, change it up to fit your style.
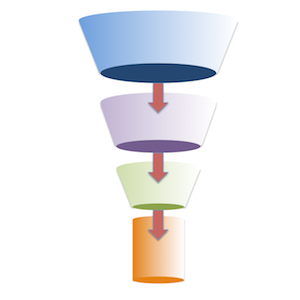
That said, I’ve found some cool ways of using the single-pixel solution to work really well in maximizing efficiency in remarketing campaigns for a couple of my accounts. The one I’m going to talk about specifically has a funnel that looks something like this:
Category Page >> Product Page >> Product Customization (size, color, etc.) >> Cart >> Confirmation Page
I’ve also run it on funnels that look something like this:
Sign-up page >> Verification >> Define Service Interest >> Lead
Now, the way I used to run remarketing – and the way a lot of people I know still run remarketing – was that I would focus on two elements: Cart Abandonment and everything else. I ran two scenarios: 1) people who had abandoned the cart in the last 7 days with converting users negged out; 2) people who had visited the site in the last 30 days with cart abandoners from the past 7 days and converting users from the last 30 days negged out. And it worked, but as with everything in online marketing it can always work better.
Pre-single pixel, you needed a pixel for each time frame, each stage in the funnel, and any action you wanted to bucket into an audience. If you wanted to get that sophisticated, the client’s site would be littered with remarketing pixels, and getting them put up or taken down was always a hassle.
The single pixel allows you the kind of flexibility that was always such a chore previously. You can easily bucket an audience based on pages they’ve visited and use different time frames with a quick couple of clicks.
So, using my funnel example above, I created pixels for each page in the funnel for 4 different time frames: 1, 3, 7, and 30 days. My bidding structure was as follows (simplified, but you get the idea): highest for most recent traffic and people who reached deepest into the funnel; lowest for older traffic and people at shallower places in the funnel.
The idea here is that someone who has abandoned a cart in the past 24 hours is much more valuable than someone who abandoned it 7 days ago, and both of those segments of traffic are more likely to convert than someone who visited a category page but didn’t take any more intent-driven action. Basically the old adage: not all traffic is created equal.
To make sure I created it cleanly, I created ad groups as follows (each target got the corresponding negative match on time frame):
– cart page visitors with confirmation page visitors negged out
– customization page visitors with cart page visitors negged out
– product page visitors with customization page visitors negged out
– category page visitors with product page visitors negged out
This allowed me to have clean buckets with no overlap and gave me some serious bidding control.
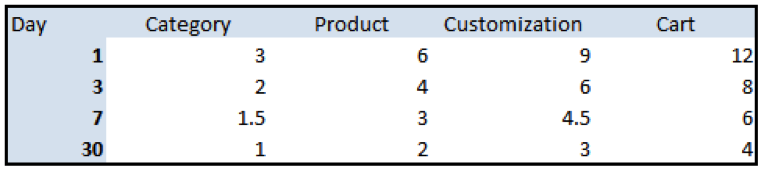
The fun part was watching how it actually performed. I had anticipated a more linear curve in how I was to bid, something to look sort of like this:
What I found was that the conversion rates increased dramatically once the user had reached the customization pages, and my bidding ended up looking more like this:
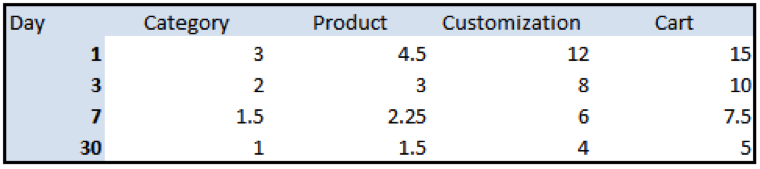
The other interesting piece is that the highest conversion volume ad group I have is the product page visitors/1 day audience – those who visited, got to a product they liked, then chickened out. This group made up 19% of my remarketing conversions over the past 30 days; the category page ad groups still reigned, as they are responsible for 37.3% of my remarketing conversions over the last 30 days. For conversion rate, though, Cart Visitors and Customization page visitors dominated, coming in at 11.25% and 8.83% respectively compared to a campaign average of 3.15%. The combined conversion rate for 1-day ad groups was 5.62%, while the 30-day combined conversion rate was only 1.81%.
The big thing here is there is some major efficiency to be gained when you break out these bids for different stages in the funnel and different time frames. Basically when I was bidding all cart traffic to one bid, and all other traffic to another bid, those customization page conversion rates were smoothing out a lot of inefficiency at the category page level. Now, following the breakout, I’ve been able to grow conversion volume while maintaining my CPA – and that’s the bottom line.
—
Tyler Jordan began in the search marketing industry in 2010 and joined PPC Associates in August of 2011. He recently held the position of PPC Manager at Build.com, where he managed hardware and ventilation categories on various sites within the company’s network of stores. While at Build.com, Tyler helped the company grow into one of Retailer Magazine’s top 100 internet retailers, overcoming Lowe’s to become the second-largest online retailer in the home improvement space. You can catch him here on his Google+
