
It’s the most wonderful time of the year… or is it? We sat down in the Hanapin Marketing offices last week to discuss our account projections this holiday season. “Don’t forget to spend heavy going into thanksgiving,” was the cry of PPC Hero’s Jeff Allen. “If you don’t, you’ll likely miss budget targets with the slow few days.”
This got me thinking, how many of us are fully aware of our PPC accounts’ seasonality? Don’t get me wrong, I know that my e-commerce clients do fantastically around Thanksgiving and Christmas, and that self-help publishing does well in January with so many people making New Year’s resolutions – however I’ll admit that at times I’ve been a little naive with how much stock I put into seasonality.
The first thing you need to start doing is benchmarking what your account should be doing without your involvement to take account of recent trends and seasonality. The reasons to do this are twofold:
- To help make accurate financial projections for your company
- To be able to judge how effective your PPC efforts are proving
How to benchmark:
The first way to benchmark your results should be to turn to your Google Analytics or AdWords accounts and look at your seasonal performance. I’d suggest looking back at least 2 years if you can – any less and you can’t tell if there are seasonal trends or just normal traffic changes. In the example below from an e-commerce gift website you can see that there are two strong times of year: the run up to Christmas, and April-May. The rest of the year stays fairly level.

However, for other industries you might see something which is a bit less obvious – while there are peaks and troughs, they don’t line up from year to year.

The trick is to build yourself a historic table of monthly increases in clicks or conversions for the past few years and benchmark yourself against the previous years change.

With something like this simple example, you can see your expected monthly performance change in traffic – you can see that from February to August every year you can expect growth, and you can expect numbers to shrink for the rest of the year. If you can outperform your monthly change average you know your work is having a positive impact.
Making charts like this can really help put your performance into perspective. If your sales are up 25% in December, you’re going to be happy, right? If you grew 15% last December, then you will be – but if your traffic was 50% higher last December you are going to wonder what you messed up.
One very real example of needing a solid benchmark happened to me a couple of years ago. Our consumer goods website was having a strong November boost as expected – everyone was happy and we kept working as normal until February when everything was just awful – sales at all time lows and lots of worried faces. Scratching our heads, and with much investigation, we realized that due to improper code implementation AdWords was only recording about 75% of our sales.
As almost all campaigns in the account were on CPA bidding, the compound damage of the lower conversion rates ended up costing us a ton of sales in November and December – it wasn’t until sales fell back down that we noticed how much better things could have been.
Where am I going with this you might be asking. Well… the moral of the story is that during our investigations we bookmarked our previous 2 years performance and noticed that while our October growth was about par, our November growth was actually much lower than expected. This meant we were able to quickly isolate the period of time when the mistake was made. If only we’d had our monthly change benchmarks in place from the start, we’d have identified issues much sooner.
Google Trends
Some of you might not have the historical data to look back at, in which case the next best tool available to you is Google Trends. Google Trends lets you compare and contrast historical search volume data from 2004 onward.

In this example, clothes retailers can see that they are going to get a serious bump for coat searches during the winter months.

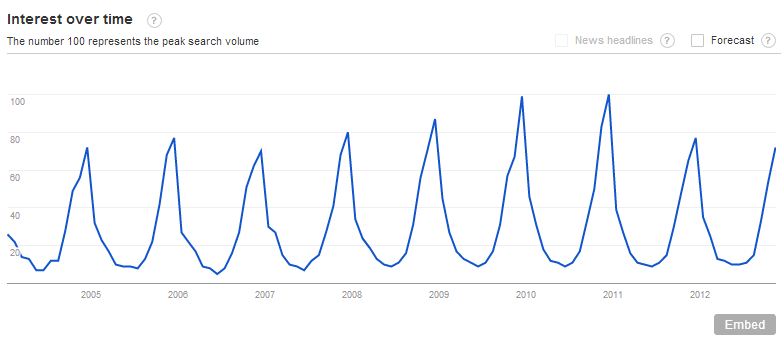
Here’s another pretty common industry that you can predict traffic for: people wanting to go to the gym. As you can see, sign ups are much higher right after New Years – roughly double what they are at any other time of year.
Spotting differences in trends:

This was something cool I wanted to share with all of you from when I was in charge of launching a US version of a popular UK site. In the UK, January is the key time of year for clearance sales. As shown above, most people in the UK are looking for new TVs (this can be applied across most major appliances) in January. In preparation for this we built out a huge ‘January sales’ campaign for our US site. However, nothing came of it at all – we didn’t see the same boost we did in the UK. Why? Well it turned out that Americans don’t have January sales – in fact the market research we later did turned up a ton of blank stares to the phrase. If we had only checked Google trends more thoroughly, we’d have noticed that everything should have been geared towards ‘Black Friday’ which doesn’t exist, or at least didn’t until recently, in the UK.
Overarching trends:
This is the part where I tell you something you already know: Your industry might be shifting. In the example below I’ve tried to show how the growth of Smart Phones affected the UK mobile broadband market. Suddenly no one needs to plug a USB stick into a laptop to get an internet connection – most people have a pretty good phone to handle browsing on the go.

This is important to benchmark because you need to be able to set realistic expectations for yourself. If your campaigns are continually shrinking, it might just be the shape of the market – your efforts will be better served finding new avenues that swimming upstream like a salmon against the flow of the river. By searching out these trends early, you can be the person who suggests that perhaps it’s time to jump on the next Smart Phone bandwagon.
Why this is useful:
Any business relationship works better when changes are anticipated and planned for, be it working with a client or reporting to a Director of Marketing. Being honest about downward market trends is important – one of our clients is currently working on a huge business expansion, with PPC expected to drive a serious proportion of their sales. When we met them in September, we were able to take the Google trends data with us to tell them that the September to December period was going to be tough for them, and that sales would most likely fall by 20-25%. By doing this, the client was able to recognize how much hard work we put in to grow sales by 8% in September and 4% in October – numbers which were below their original growth targets.
As always, if you have any comments on your industry and how it performs over the holiday season, or have any benchmarking tips to share, please do in the comments below.
