
Whenever we make changes in an account here at Hanapin we like to do what we call “Bookending”. Essentially this is creating a rough estimate of the projected impact of our changes on spend, conversions, CPA et al. It’s a fairly simple way of mitigating the potential problems at the end of the month that are common with managing PPC accounts: “How did we get so far over budget?” “Why is our CPA so much higher than we thought it would be?” If anyone questions the logic behind any of the actions we take in the account we can point to this “Bookend” and say that the changes were supposed to bring in x additional conversions at y extra cost (or cut depending on the action).
Our process for “Bookending” is by no means an exact science but acts as a general guide for our account managers to avoid doing anything that appears to just flat out not make any sense. One of my main issues with it is that in order to save time with these projections – they are meant as a rough guide after all – we make a few assumptions that are not always true. Particularly, that a keyword in a higher position will get more clicks and subsequently more conversions.
Once you realize that this of course isn’t always the case, making projections in PPC gets pretty tricky. What we’re going to dive into today are a couple of ways to work out the impact of different positions on your Keywords and why increasing or decreasing your bids might not always have the desired effect you were thinking it would. Keywords typically have a sweet spot that you want to find.
Account Level
We’re going to be using our good friend the Excel Pivot Table to help us with this, which makes fellow PPC Hero Sean Quadlin so excited he decided to go back in time and create a helpful video covering how to do this.
The first thing you’ll want to do is go to your account and download a keyword report. I typically look at the past 90 days of data here so that I can get enough information without being too affected by seasonal trends. Be careful selecting your date range if you do have a highly seasonal account as what worked well this summer might not have worked so well in the spring.
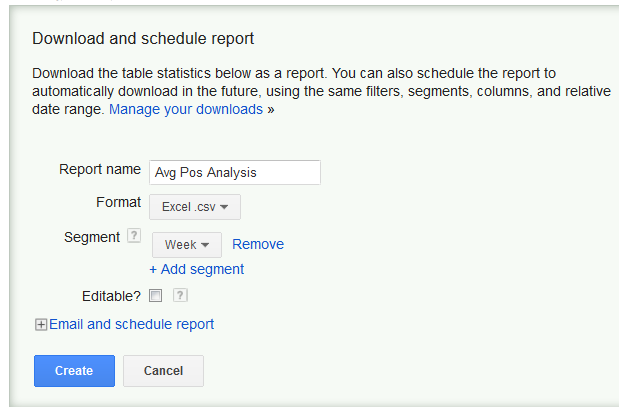
Make sure to add a segment to your data. In this case I’m doing week, but if you make daily bid changes (or if you have software that does) then you’ll want to see your data at this level. Segmenting here helps us to take account of the variation your keywords have in variation over those 90 days due to your bid changes, competitors etc. etc.
Open up your keyword report, delete out your “total” rows and create a Pivot Table – In Excel 2010 this is under “Insert -> Pivot Table.”
In your pivot table builder, add average position to your Row Labels and clicks and conversions to your values. We’re also going to be adding 3 calculated fields: Calculated CTR, Calculated Conversion Rate and Calculated Cost per Conversion.
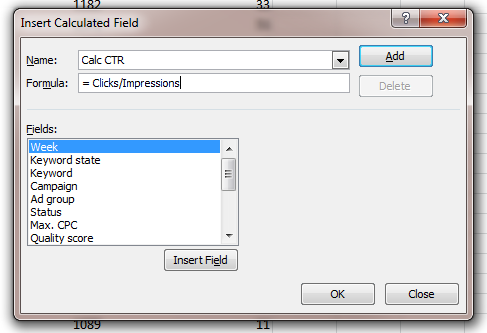
For reference:
- Calc CTR = Clicks/Impressions
- Calc C/R = ‘Conv. (1-per-click)’/Clicks
- Calc Cost/Conv = Cost/’Conv. (1-per-click)’
n.b. If you use many-per-click conversions as your KPI make sure to use those instead in the above formulae.
Once you’ve done that go ahead and format your table so that CTR and C/R show as “Percentage” and Cost/Conv shows as “Accounting”. This isn’t necessary if you see data like the Matrix washing over you, but for my tired eyes it’s a very necessary step.
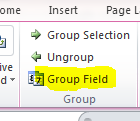
The final step here is to group your average positions to make them a little more readable.
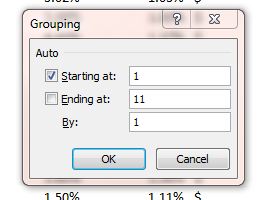
Go ahead and set your intervals at however granular of a detail you would like. For this example we’re going to use increments of 1 to keep things simple, but you might want to go by .5 or .25 etc.
Hopefully you should now see something like this:
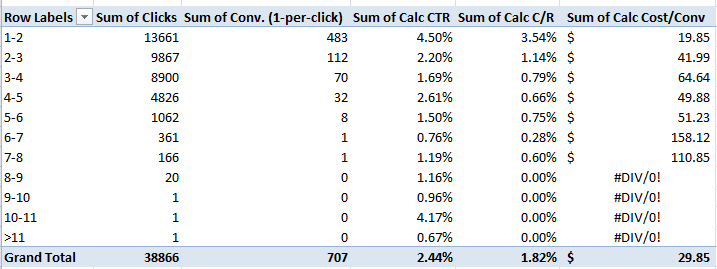
You can see here that the top position performs really well for us for all 3 metrics. So for this account the sweet spot really is top position.
However, this account level data for your best position can be a bit misleading. After all, you might have a messed up bidding strategy that currently leaves your best converting keywords in position 6 and pushes bad keywords up to position 2. If you fail to account for branded keywords you’ll also get a huge swing towards position 1 being much better for conversion rate than it necessarily is too. You can fix this by adding “Campaign” to your Report Filter in your Pivot Table Builder and then filtering out any brand campaigns.
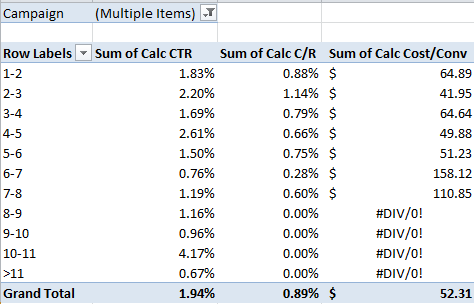
When filtering out that brand traffic, you can see our sweet spot is actually positions 2-3. We also get a nice bump at positions 4-5.
Keyword Level
The reason to go down to a keyword level rather than accept the account level data is that each of your keywords will perform differently. You probably won’t have enough data to analyze all your keywords, but getting an insight into your top 5 or so might help you make some smart bidding decisions.
There are two ways to find out your best positions on a keywords level – the fun Excel way, and the boring but much more simple Google Analytics method.
For Excel, it’s pretty much the exact same process as highlighted above for at the account level. However, I tend to segment by day rather than by week for added data. You have a couple of options here – you can either re-download your report from scratch, only downloading the keyword you are interested in, or you can add a filter to your pivot table builder to just get one keyword in particular.
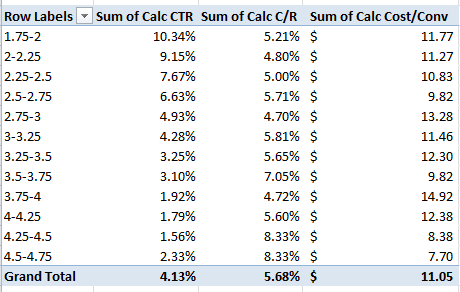
This data comes from our top performing non-branded keyword. A couple of sweet spots seem to emerge – 2.5 to 2.75 and 3.5 to 3.75.
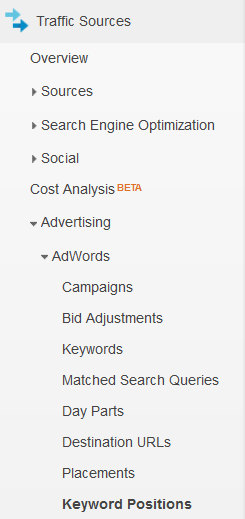
You can also get all of this data through Google Analytics. Open it up and go to Traffic Sources -> Advertising -> AdWords -> Keyword Positions. You will need to link your AdWords and Analytics to do this.
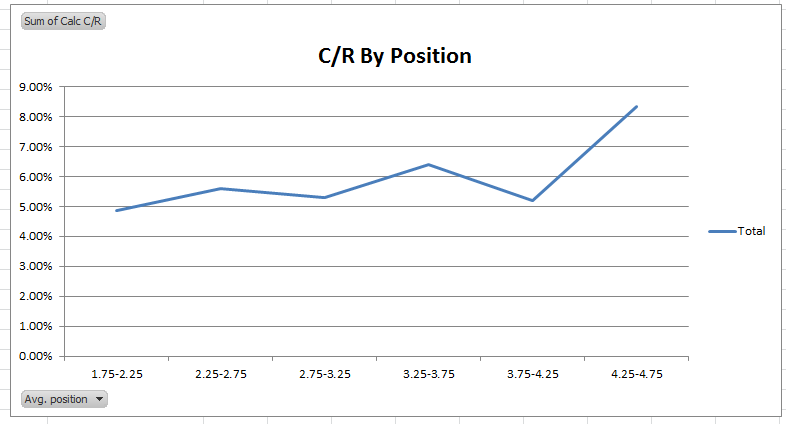
Once here you can sort your keywords by visits and then dive into them one at a time. In this case, here is the Conversion Rate for paid conversions on my most visited non-branded keyword:
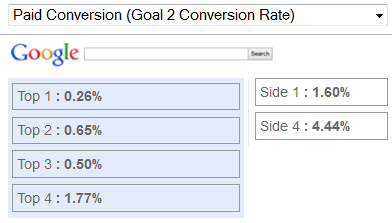
You can also check the visit numbers to each of those positions to make sure the high C/Rs aren’t just because of a single conversion from a low number of clicks. From the table above it looks like position 2 is probably where I want to be on the top, and that I should investigate the value of being in the top spot on the side (4th position).
Check out this video from Fred Vallaeys for more details on how to find your conversion rate by ad position through Analytics.
Making use of this data
As Chris Martin from Coldplay wants me to do, I’m going back to the start. That is to say, I now have better data to help guide me make my bookends. I can now work out roughly the percentage that my CTR and C/R will change when I set my new bids.
If you notice very distinct trends you can also set up automated rules to maintain your keywords in a specific position. Let’s say you’ve worked out you always want to be in position 4 for example – why not make use of a pair of automated rules to keep your keyword at that position?
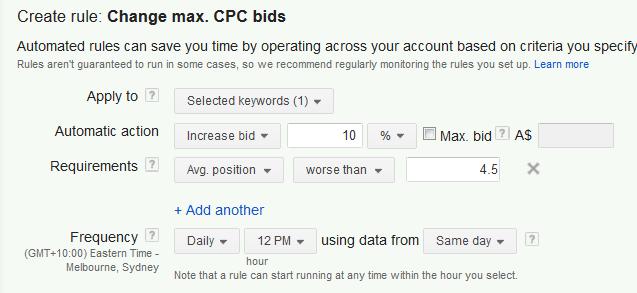
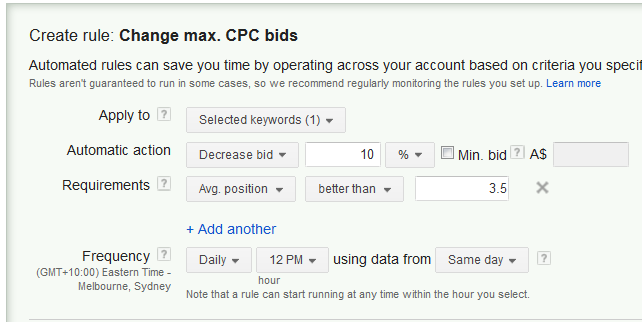
The two rules here, which can be found in your Keywords tab under “Automate” and “Change max CPC bids when…”, are set up to bid up any time my keyword falls below position 4.5 and bid down whenever it goes over 3.5 to maintain it in that sweet spot. You might want to be more careful than me and also add a minimum and maximum bid for safety.
As always, if you have any questions or tips of your own, let us know about it in the comments below!
