Determining The Weight AdWords Puts On Quality Score Factors – A Case Study

The most mysterious part of AdWords is said to become less of a mystery in the coming weeks. Google will reveal to us a bit more about how they calculate quality score, but how much more, we have to wait and see.
The work of improving quality score has been challenging over the years. Even for our brand terms, we get as little as 5.
In order to see the most improvement in the shortest time, we wanted to see if either changes to ad copy or landing pages would be more significant and easier to achieve. Before running this test, we wanted to check how statistically fair AdWords is for running these types of tests, so we decided to run an A/A split test of all the ad groups. The idea of running an A/A test was to determine how much noise (i.e. natural variation), there is in the test and measurement system.
How Did We Setup The Test?
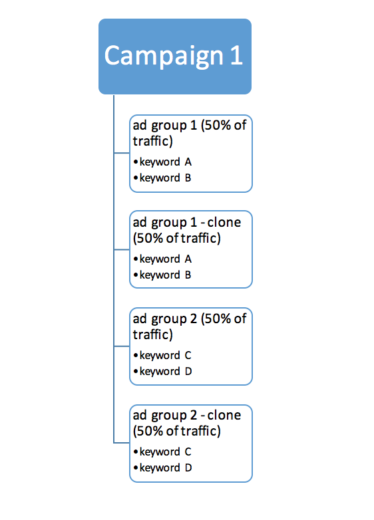
To run our test, we created a new campaign. I have cloned all the ad groups and run an AdWords Experiment (FYI, since 10/17/16, it is no longer possible to set up new experiments). The experiment and control ad groups were getting 50% each of all the traffic. The structure of the campaign looked something like this:

Each ad group was an exact clone of another one, each of them serving 50% of the time, with exactly the same set of keywords and their matching ads, using the same landing pages. Everything was the same within each pair of ad groups.
The Findings
We let the campaign run for over a month. During this time we received 209,667 impressions and 2,978 clicks.
Finding #1
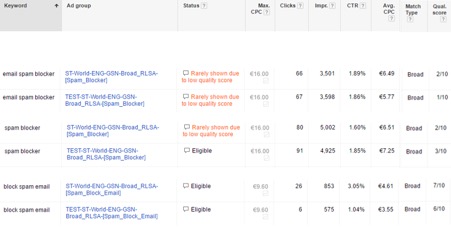
The same ad copy weren’t seen as equal by AdWords. The sets of keywords below had their quality score difference due to a different ad relevance (CTR and landing pages scores were equal).

Finding #2
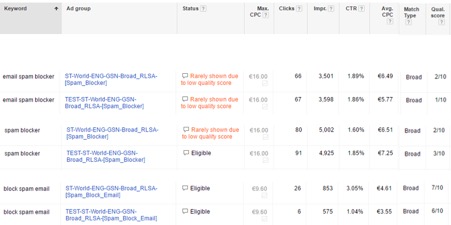
The higher quality score isn’t always better. In the two examples below, believe it or not, the factor affecting the quality score was the CTR (yes, the higher QS had lower CTR yet their CTR scored better within the QS breakdown).

Finding #3
Higher quality score doesn’t automatically result in a lower CPC.

What Was AdWords response? After a couple of weeks of back and forth emails to several teams including AdWords Search Support Specialists and Product Specialists, we received the following answers:
1. “Quality Score (QS) is based upon exact match performance, not performance on other queries (broad match, phrase match).” And “When using phrase match or broad match performance to calculate quality score, we tend to see higher volatility as it is not as accurate as when we use exact match.”
It sounds like we have very little control over broad, BMM and phrase match QS. Based on this response I set up another experiment using exact matches only – see below.
2. “Average CPC will be dependent upon the auction that each keyword is entering, and also the specific search term that triggers each keyword.”
We do know that our CPC will depend on the auction, which means that the higher quality score doesn’t automatically mean that we’ll pay less for the click. Yet we can often read that if we increase our QS our CPC will decrease (still see that lovely table showing that above a certain QS we are discounted and below that number our CPC increases). That would only work in a world where each auction was exactly the same, where all the conditions would be equal. However, that’s not the case and each auction is different.
3. Quality score is measured based on the following factors:
- Your ad’s expected CTR: We know that one
- Your display URL’s past CTR: The historical clicks and impressions your display URL has received
- The quality of your landing page. We know this one
- Your ad/search relevance. We also know about that one
- Geographic performance: How successful your account has been in the regions you’re targeting
- Your targeted devices: How well your ads have been performing on different types of devices, like desktops/laptops, mobile devices, and tablets
Most of us are aware that our historical performance and targeting settings do have an impact on the auction, but that they directly affect our quality scores?
Our Second Test – Exact Match
The most repeated statement from my correspondence with AdWords Support was that they primarily use exact match performance to calculate the QS. And when using phrase or broad match performance to calculate the quality score, it’s possible that we will see higher volatility as it is not as accurate as when using exact match.
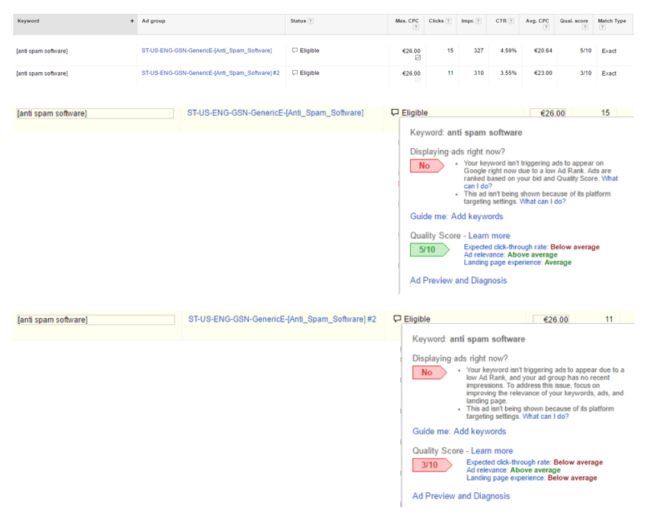
Wanting to test this new found fact and to see if my results would be similar to my broad match keywords or to what AdWords was saying, I set up the same test for my exact match campaign. Here my findings were mixed. Since I was using exact match, gathering statistically significant numbers in order to for the result of the experiment to be conclusive and not down to chance, a lot of my pairs of keywords did not receive enough clicks or even impressions to share. However, there was still one set with enough data to show you the difference in the quality score (there were several sets of keywords that had different quality scores but were lacking enough data).

As you can see, my landing page experience in one ad group was “average” whereas in the cloned ad group it was “below average” (same keyword, same ad copy using the same landing page), which resulted in knocking off two points of my QS.
Going Forward With My Takeaways
Don’t take your quality scores for broad, BMM or even phrase keywords too seriously. The only match type that we seem to have some control over is exact. I don’t know how many times that was said but QS should not be our focus or, as it seems, even a guidance. Give your visitors seamless experience and tailor your ads with your landing pages to match their search query as closely as possible.


