
Testing new ideas is a core component of digital marketing strategy – in fact, our agency believes it is the core component. Experimentation, whether it be ad copy, a landing page, a bid strategy, or new campaign type, allows each advertiser to hone in on the most effective tactics for them, and iterate on successes without risking huge downsides.
That test and learn approach gets complicated, though, when testing one change across multiple campaigns or accounts. Last month, I outlined some general tips for managing an advertiser whose campaigns are spread across multiple CIDs (and reflected on the legacy of a 2001 Palm d’Or nominee). In this month’s post, we’ll expand on that topic, taking a deep dive into tracking and presenting test results when testing a change across multiple accounts.
The Situation
One of our clients advertises multi-family housing for roughly 250 different properties, each with their own advertising account and goals. One aspect of working with this client that is particularly exciting and gratifying is the ability to evaluate tactics more quickly in the aggregate more quickly than we would be able to if just looking at the data for one particular account. In this particular case, we have been testing the inclusion of Responsive Display Ads in remarketing campaigns that had previously been running just image ads. (note: for a primer on Responsive Display Ads, see Andrew Harder’s excellent post on the topic here).
One issue that made measuring the performance of these RDAs relative to the traditional image ads tricky is that the RDAs were not added and enabled all at the same time. As such, we had to devise a method for tracking performance for each RDA relative to the image ads in its same campaign group only after the RDAs had been enabled in that campaign. Otherwise, we would risk including data from image ads that had been running previously, which would capture differences in performance due to seasonality as well as ad type. To try to pull and update that data manually across so many different campaigns and accounts would have been an unreasonable investment of person hours.
The Solution: Automated Data Queries And Google Sheets
Instead, we created a query (using Supermetrics, but also possible with other tools such as the Google Ads add-on) to pull data for each account into a Google Sheet, segmented by ad type, campaign name, and date. We then created a separate tab to record the date the RDA was implemented for each account. Finally, we created a client-facing tab that presented the performance of the RDAs relative to the image ads for each account. You can see a screenshot of that table below:
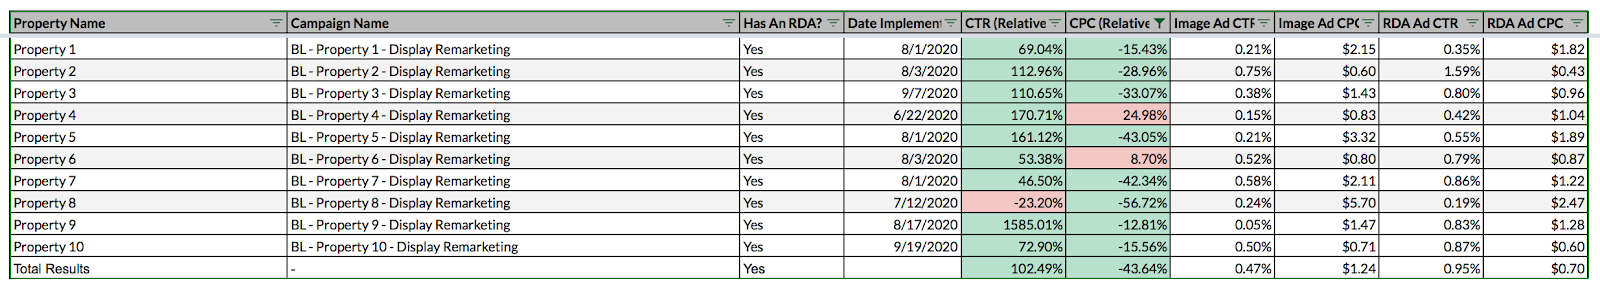
This approach allows the client to see how the RDAs are performing in the aggregate, as well as the performance for each particular campaign and account. In this case, you can see that the RDAs typically outperformed the traditional image ads. From here, this data can help you unlock more productive conversations like:
- Do we recommend the thing that was tested for all accounts moving forward?
- For the accounts where the test did not outperform the legacy strategy, are there commonalities that could explain the performance?
- Are there any major outliers where we’d recommend removing one ad type or the other from the campaign?
For those of you interested in duplicating this sort of approach in your own work, here are some of the technical aspects related to how we set up this reporting table. In hidden columns there are sumif formulas that reference the raw data being fetched by our automated query. Those sumif formulas reference both the campaign name and the date such that each cell is only pulling in data for dates post-test-launch and for the intended campaign and ad type. For example, the formula to sum impressions for a campaigns’ RDA impressions looks like this (with the referenced columns and cells identified in parentheses):
=sumifs(‘Raw Data’!F:F (impressions),’Raw Data’!$D:$D (date),”>=”&$F21 (date launched),’Raw Data’!$L:$L (campaign name and ad type concatenation),$C21(campaign name)&”Responsive Display Ad”)
Conclusion
Testing is more important than ever when managing the digital marketing of a complex business. Sometimes, though, the structure of that business makes it difficult to conduct tests in an organized manner that allows for an analysis of both aggregate and specific data. Creating a system for doing so in advance is essential to ensuring that you’ll be able to make data-driven decisions. The case above outlines one particular strategy for presenting and analyzing experimental data across multiple CIDs, but aspects of that strategy could be adapted to a variety of situations, including intra-account data across multiple campaigns. The main takeaway from this is not necessarily that the strategy outlined here should be duplicated exactly, but rather that it is essential that account managers consider how they can present the results of those tests efficiently and effectively
