As PPC managers, we all know that to get a clear understanding of PPC performance you can’t just look at AdWords alone, but the discrepancies between AdWords and Analytics data due to click attribution can be frustrating. With the release of Multi-Channel Funnels, Google has helped to resolve this issue by showing how different marketing channels work together to create conversions.
This guide will go through the basics of Multi-Channel Funnels and how you can use this feature to improve performance for your accounts.
Table of Contents
Chapter 1: Multi-Channel Funnels Basics
Chapter 2: The 5 Multi-Channel Reports
- Overview Report
- Assisted Conversions Report
- Top Conversion Paths Report
- Time Lag Report
- Path Length Report
Chapter 3: Channel Groupings
- Basic Channel Grouping
- Custom Channel Groupings
- 3 Steps to Creating a Custom Channel Grouping
Chapter 4: 5 PPC Questions To Answer Using MCF
Chapter 5: Improving PPC Performance With Multi-Channel Funnels
- Find Valuable Keywords
- Allocate Spend to Increase Conversions
- Assess Display Network Placements
Multi-Channel Funnels Basics
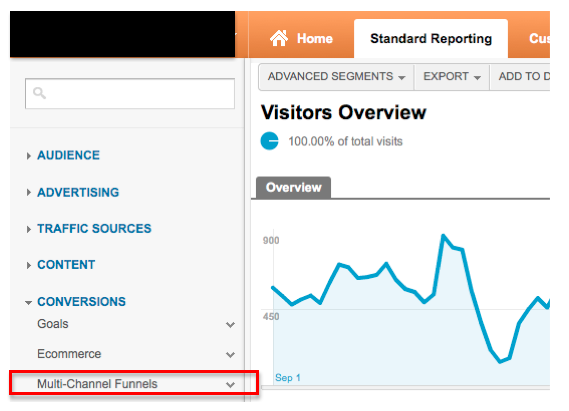
To use the multi-channel funnels reports, you must have e-commerce tracking or goals enabled and be using the new version of Analytics. To navigate to these report, click on the “Conversions” in the left hand column and select “Multi-Channel Funnels”.
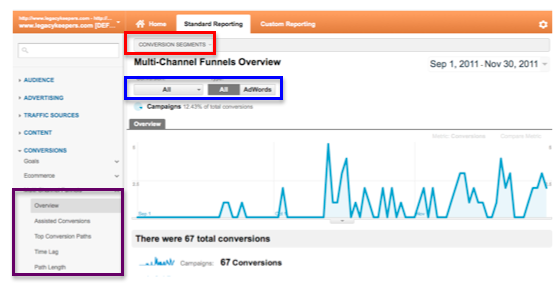
When you click through, you will see the 5 available MCF reports, starting with the Overview report. I want to walk through some of the basic features on this page. (Click to enlarge.)
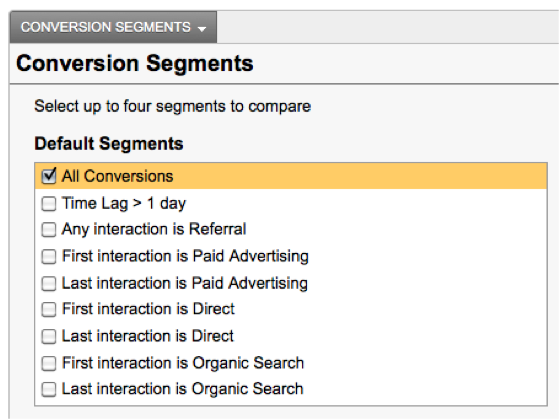
Boxed in red is the conversion segments menu that allows you to add default segments to your report. You can also create user-defined segments to further filter your data. Below is the list of current default conversion segments.
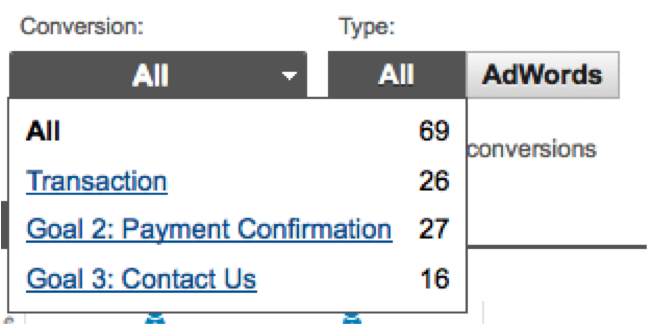
 Highlighted in blue is where you can select what type of conversion you want to look at. Clicking on the drop down box under conversion will show you all the different conversions you have set up in your account.
My favorite part of this whole report though is definitely the type option. Simply by clicking from all to AdWords you can view just the conversions that were influenced by AdWords.
The section boxed in purple contains the five reports available for multi-channel funnels. I’m going to go through each of these reports in a little more detail to show you how you can utilize them to evaluate PPC performance.
The 5 Multi-Channel Funnel Reports
This set of five new reports in Google Analytics helps give PPC managers insight into the full path-to-conversion over a 30 day period, not just the last click.
1. Overview Report
This is the first page you are taken to when you click into the Multi-channel Funnels section. It’s a summary page that compares the number of conversions and assisted conversions over the selected time period. (Note* For any of these reports, you can set the date range to whatever time period you want to analyze. However, as of right now Google is only planning on expanding the data in these reports back to January. )
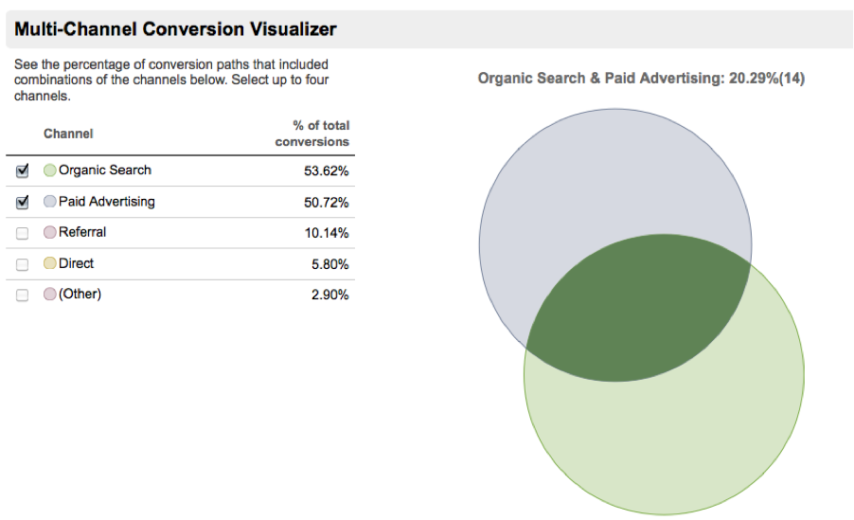
The overview report also has a handy feature called the Multi-channel Conversion Visualizer, which shows the percentage of total conversions by path, and includes different channel combinations.
In this account, 53% of conversions include organic search somewhere in their path and 50% include paid advertising. About 20% of conversions include both an organic search channel and a paid advertising channel in their conversion path.
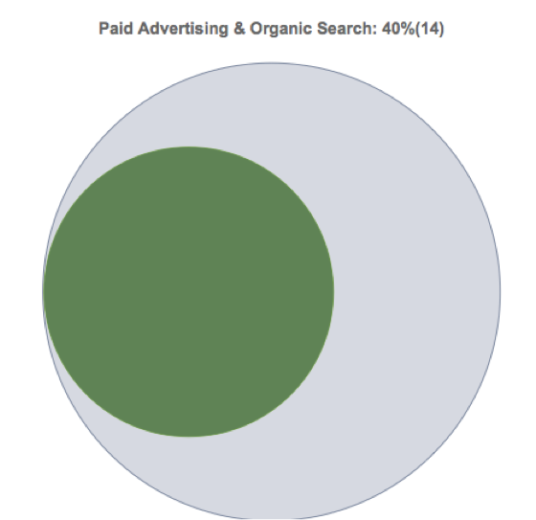
Here’s another way to look at this data. If you select AdWords for the conversion type, this is the resulting chart:
Something interesting I found was that of all my conversions that included a click on a PPC ad, 40% also included organic search somewhere in the conversion path. This shows you why there is going to be discrepancies between what AdWords and Analytics reports based on click attribution.
2. Assisted Conversions Report
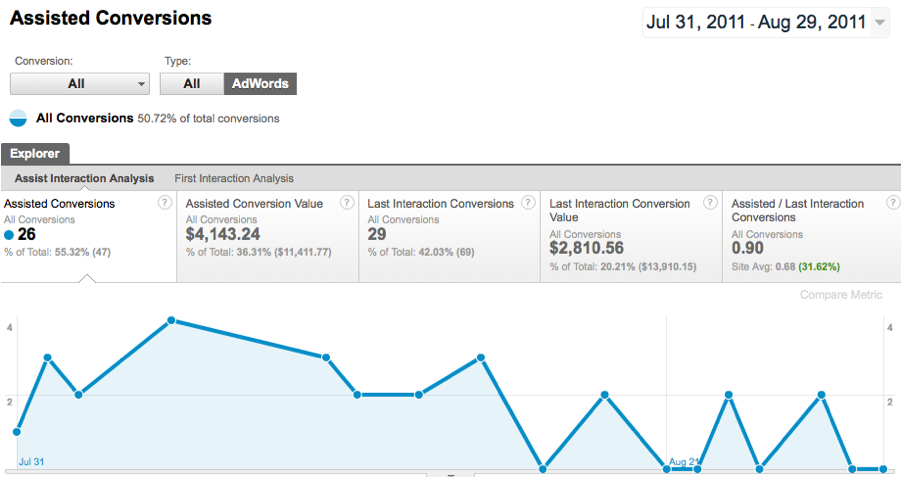
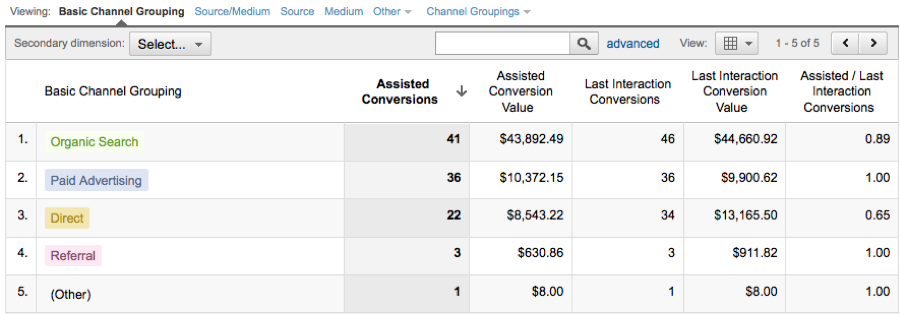
The assisted conversions report shows how many sales and conversions each channel initiated, assisted, and completed as well as the value of those sales and conversions. There are two options for this report, Assist Interaction Analysis and First Interaction Analysis. Below is the Assist Interaction report.
In the last 30 days, a PPC ad assisted 26 conversions and was the last interaction point on 29 conversions. What is most noticeable, and something you should definitely point out to clients, is that PPC ads generated $2,810 for last clicks but generated $4,143 in assisted conversions. Even though PPC wasn’t that final step, it was a link in the chain for those conversions, without which may have not been completed.
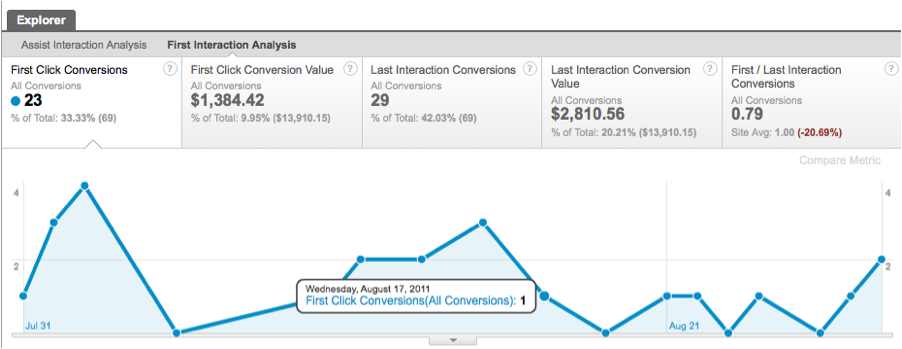
If you switch to view the First Interaction Report, you can see where PPC ads initiated the conversion path.
In this account, PPC ads initiated 23 conversion paths, which resulted in $1,384 in revenue. These reports show how valuable PPC ads can be even if they aren’t the last interaction a customer has before purchase.
3. Top Conversion Paths Report
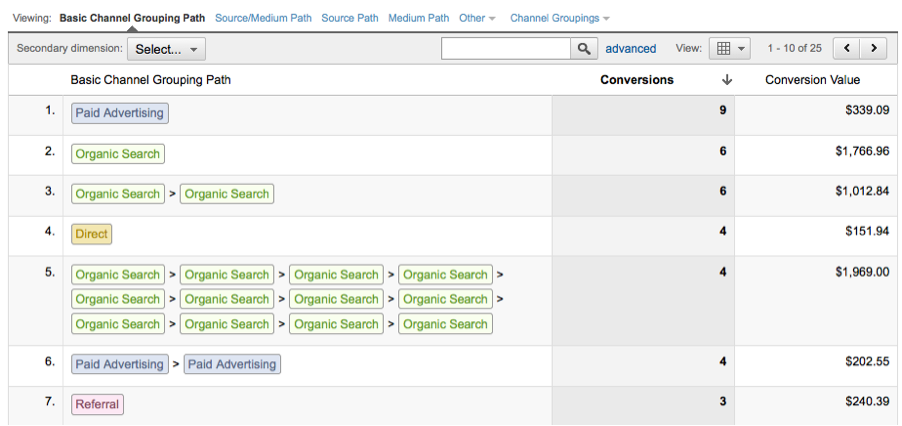
The top conversion paths report shows all the unique conversion paths that lead to conversions, the number of conversions from each path, and the value of those conversions.
The above is the screen shot for the basic channel grouping path. You also have options to group by source, medium, and other traffic and AdWords sources. You can also create custom channel groupings, which we’ll cover later in the guide.
4. Time Lag Report
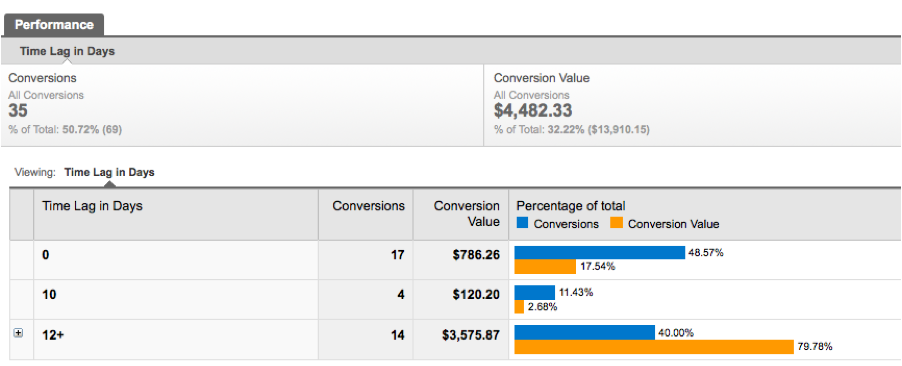
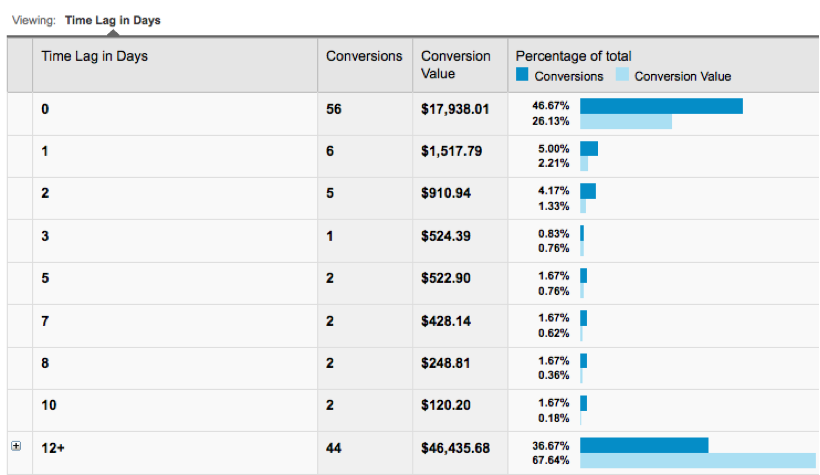
The time lag report shows you how many conversions resulted from conversion paths that were anywhere from 0 to 12+ days long.
This report will help give you insight on the length of your sales cycle. For this account, about half of the purchases were made the same day. Forty percent of conversion though took 12 or more days to be completed.
Notice that these longer lag time conversions also were more valuable. This makes sense as buying cycles are typically longer for more expensive products. This lag time explains why you might see conversions for previous months appearing in AdWords after the month is over.
5. Path Length Report
The path length report shows how many interactions visitors had with your site before they converted.
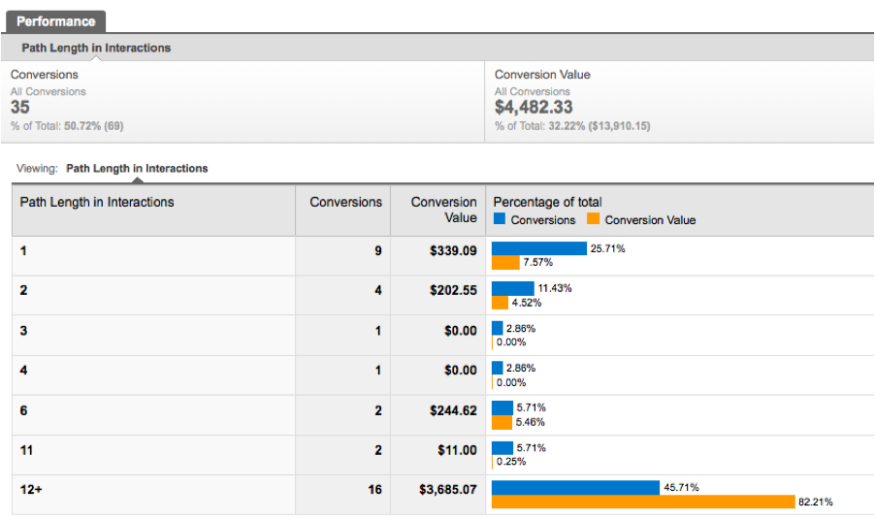 For this account we again see the same trend, where some conversions happen with 1 or 2 interactions but many take 12 or more interactions before a purchase is made. These interactions are also where we are generating the most revenue.
Channel Groupings
Channel groupings are sets of labels that categorize sources of traffic to your site. There is a pre-defined default channel grouping used in the MCF reports called the Basic Channel Grouping. This grouping provides a lot of insight into the conversion process, but if you have specific analysis requirements you can also create custom channel groupings and apply the labels that you want to include in your reports.
The Overview, Top Conversion Paths, and Assisted Conversion reports all use the Basic Channel Grouping by default. However, in the Top Conversion Paths and Assisted Conversions reports, you can apply any custom channel grouping that you have created. The Time Lag and Path Length reports do not include any information about source channels.
Next we are going to go a little more in depth about Basic Channel Groupings and how you can create your own Custom Channel Groupings.
Basic Channel Grouping
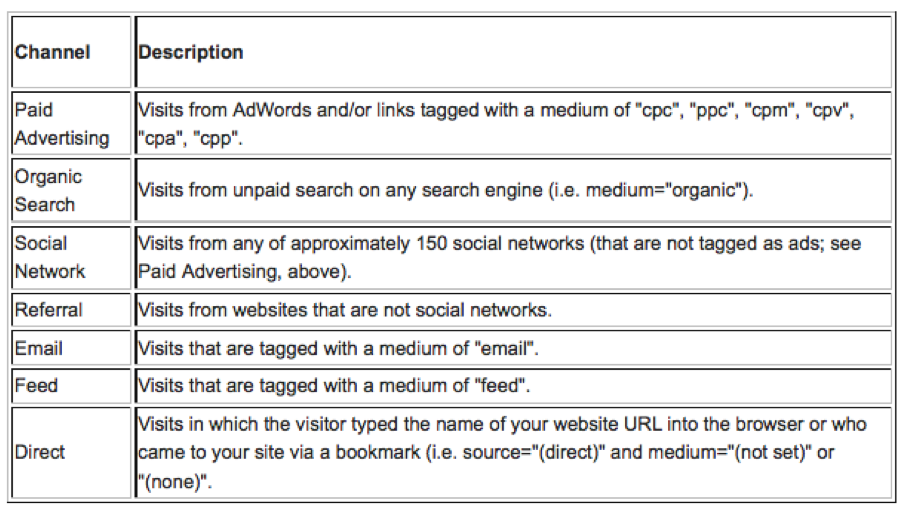
The Basic Channel Grouping is already set up in all MCF reports. The table below provides a brief description of the seven basic channels.
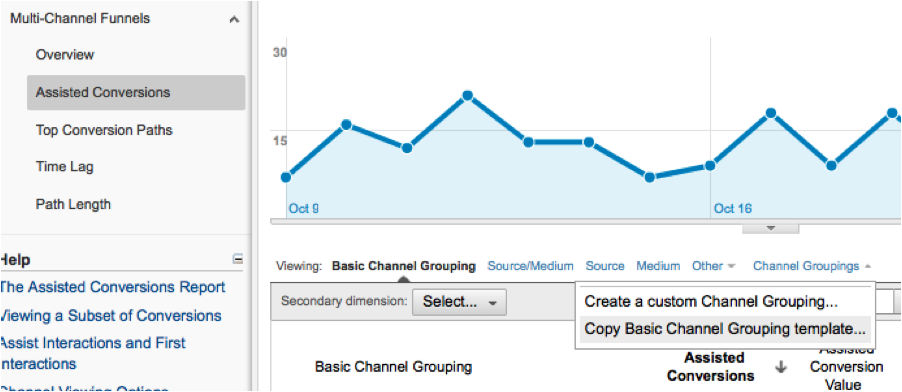
Each of these labels is defined in a similar way that you define custom filters in analytics. You can view the parameters for each of these labels by clicking into either the Assisted Conversions or Top Conversions report. Click on the Channel Groupings drop down and select “Copy Basic Channel Grouping template…”
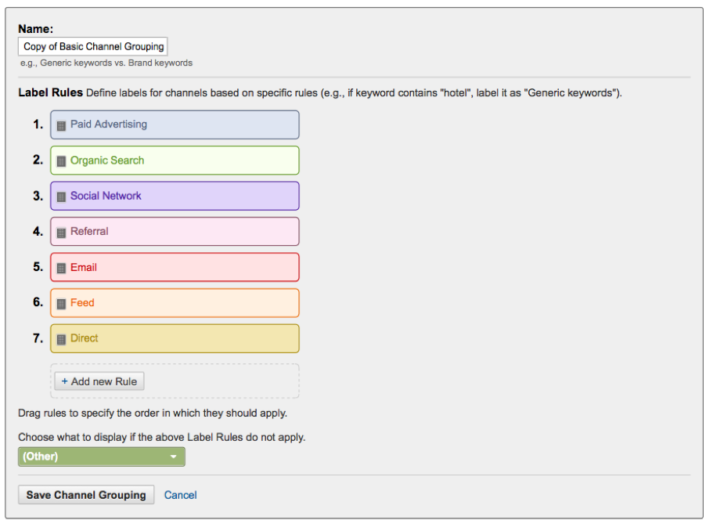
This will take you to the page where the Label rules are defined.
To view the specific rules for each label, mouse over a label and click edit. This will expand the Label to show you conditions.
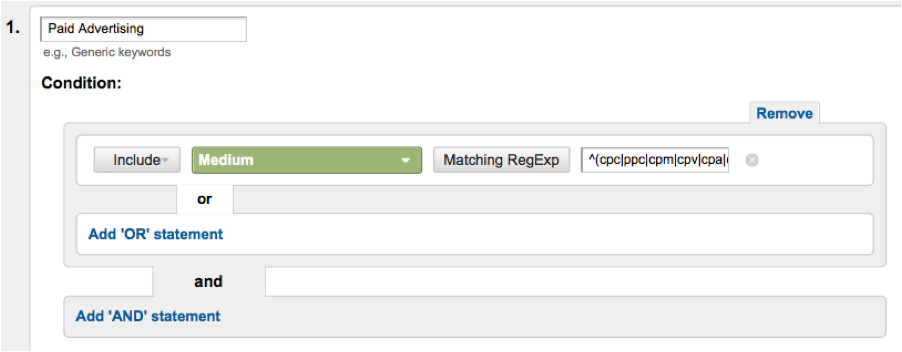
In the basic channel grouping, Paid Advertising is defined as all sources of traffic where the medium matches the regular expressions listed above. I would recommend taking a look at all of the labels to truly understand how each is defined. This will make it easier when it comes to creating your own custom channel groupings.
Custom Channel Groupings
While the basic channel grouping provides a lot of insight, you may want to create your own channel grouping based around channels you want to analyze in your report. You can currently create up to 25 custom channels per profile in Analytics.
When you are creating your own channel groupings, it is important to note that each label works as a filter and the labels are applied in the order they are defined. The first label catches all the channels that meet the criteria, the ones that don’t are passed to the second label and so on down the line.
To give you a clearer picture of how this works, I’m going to walk through the step-by-step process of creating a custom channel grouping.
3 Steps to Creating a Custom Channel Grouping
For this walk-through, I’m going to create one that is valuable to all PPCers – Paid Search vs. Display.
To create your custom channel, you’ll need to follow the same process outlined above for viewing the label rules of the Basic Channel Grouping. Click into the Assisted Conversion or Top Paths report and click on the Channel Groupings drop down menu.
You have two options to build a custom channel grouping, either Create a custom Channel Grouping or Copy Basic Channel Grouping template. If you are unfamiliar with creating custom channels, I recommend copying the existing template to get started. Once you select which method you want to use for creating a custom channel grouping, you’ll be taken to the editing window where you can start creating your channel.
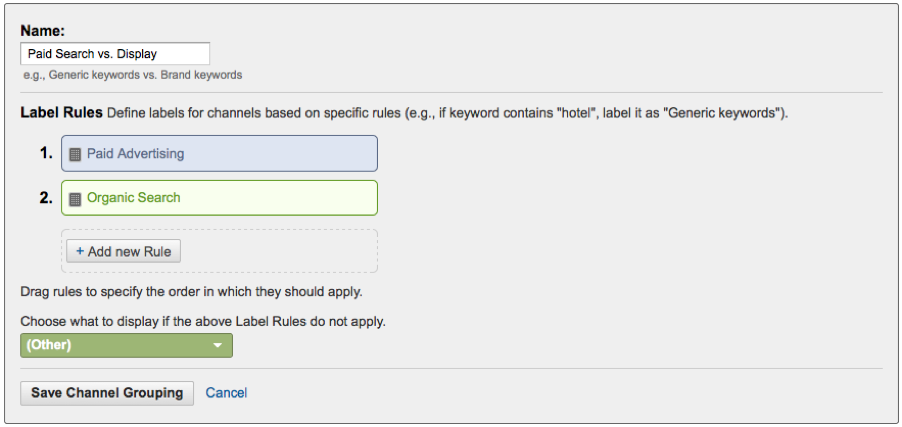
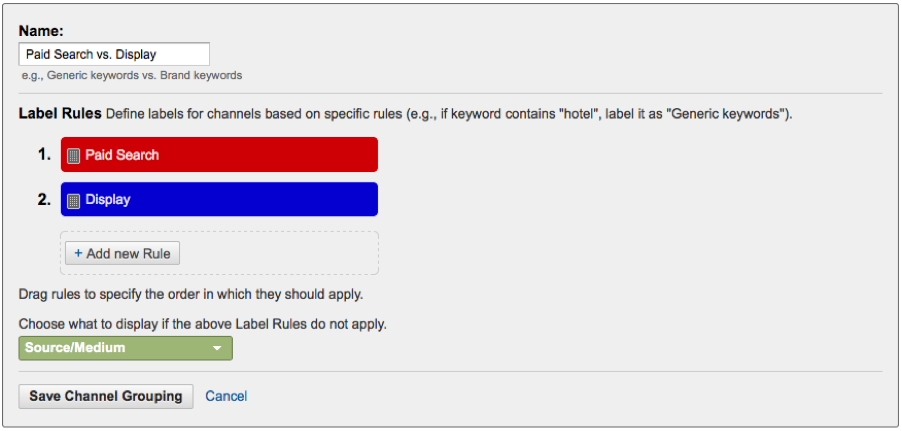
1. Name Your Channel. The first thing you want to do is name your channel. Since I’m want to look at the performance of paid search ads verses display ads, I’m naming my channel “Paid Search vs. Display”.
2. Define Label Rules. I know I want to compare two channels, paid traffic from search ads and paid traffic from display ads, so I’ll need to define rules for each. Since I’m using the Basic Grouping as a template, I’m going to delete all but 2 of the current labels. You can delete a label by mousing over it and clicking delete.
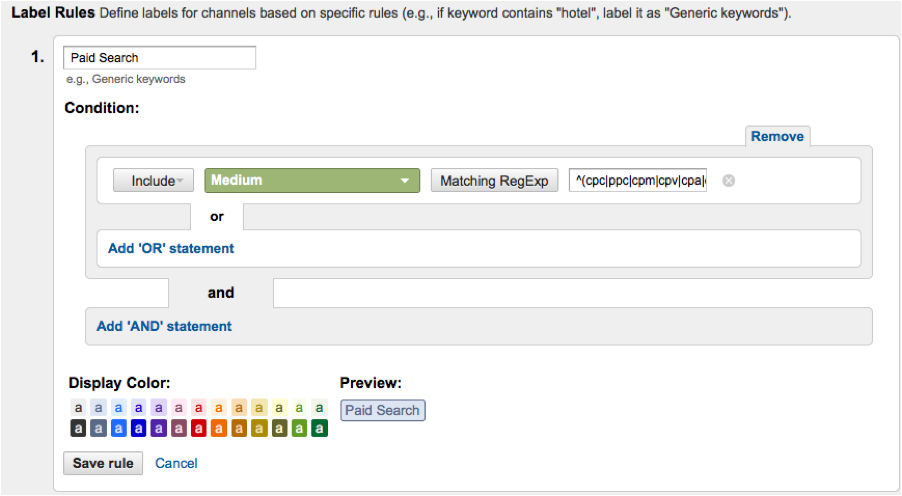
Now I’m going to edit the remaining labels to apply the appropriate rules. First, I need to change the label from Paid Advertising to Paid Search. I’m going to leave the first rule, which has the medium defined as any paid traffic.
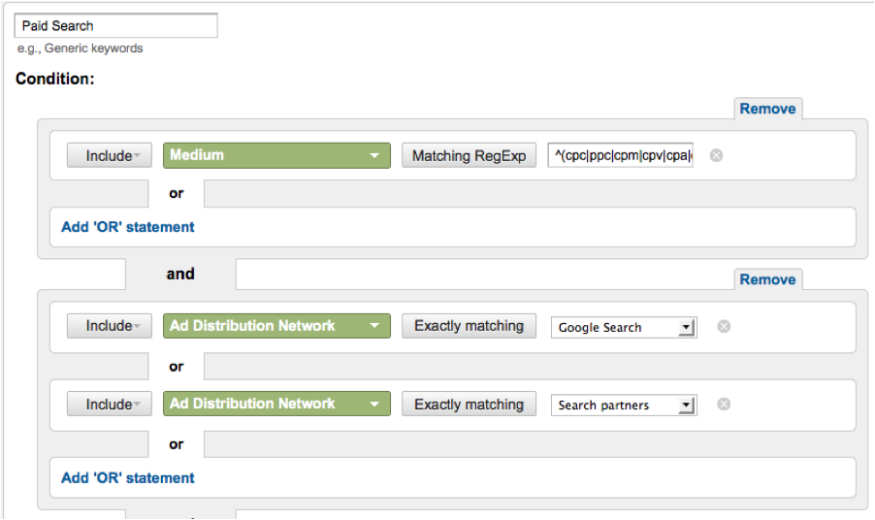
Since I want this label to show traffic that came from paid AND from the search network, I need to add an AND statement.
When you select Ad Distribution Network, a drop down box appears with a list of the criteria you can choose. Notice that both Google Search and Search partners are on the list. You can create another label in this channel to look at performance of Google Search and Search partners separately, but for this example I’m going to include them both in the Paid Search label.
To do so I’ll have to now add an OR statement to include Search partners.
Now you just have to select a color for your label and click Save rule.
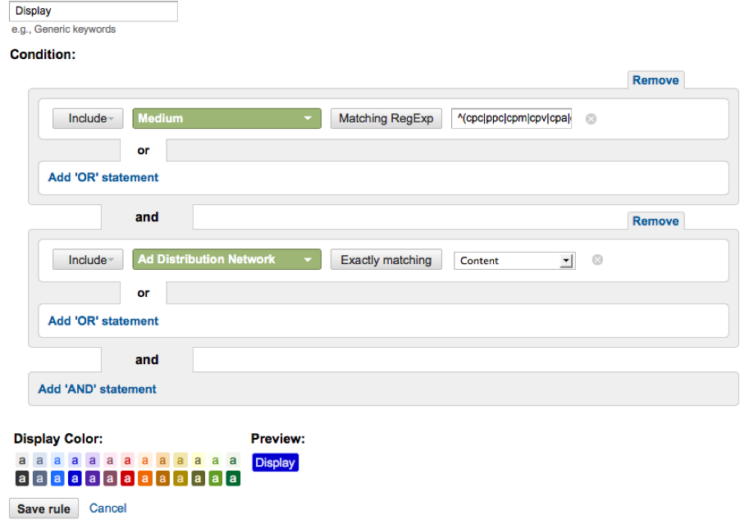
Next I’m going to edit the Organic Search label to create my Display label. Below is the screen shot of the rule set-up.
3. Choose Label if Rules Don’t Apply. Now that you’ve defined your labels, the next step is to determine how you want other channels to display that don’t fit into the labels above. The default is to just leave it as “Other”, but since that doesn’t provide much insight, I am going to choose Source / Medium. If a channel doesn’t fit into the labels, the report will display the channels source and medium.
Click “Save Channel Grouping” and you’ve just created your first custom channel!
*Note. If you set up this channel as defined above, it will only include Google traffic in the Search and Display Label. If you only have Display ads running in Google, you can set that label first to catch all of the Display ads. The second label will be paid search and just set the source = cpc, which should catch all other PPC traffic from any source. If you have Display Ads running on both Google and Bing I’m not yet sure how to include them both in the filter.
5 PPC Questions To Answer Using MCF
Below are 5 questions every PPC manager should answer using MCF to get a better understanding of their account.
1. How much does PPC interact with other marketing channels?
Why it’s important to know: If there is a lot of interaction between different marketing channels in a conversion, just reporting AdWords conversions is not enough. You will be missing a large part of the picture and won’t be able to accurately assess PPC performance if you don’t know how it interacts with other mediums.
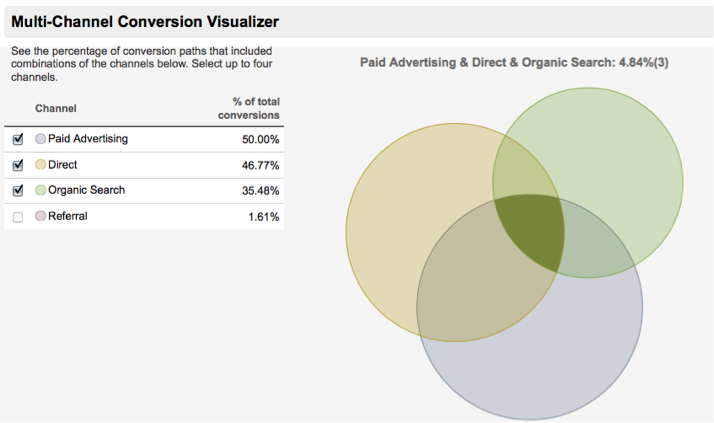
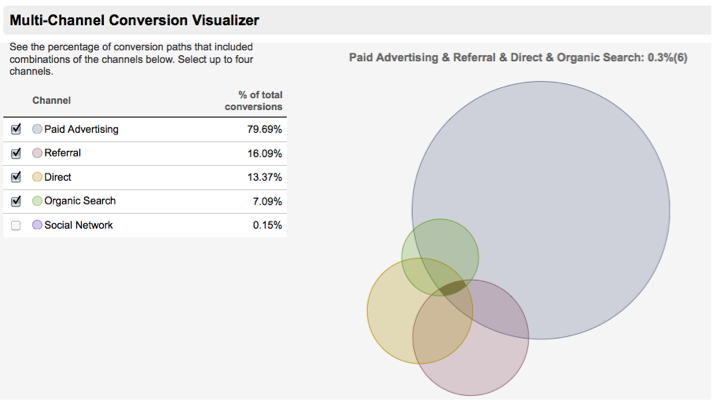
Navigate to the Overview report and scroll down to see the Conversion Visualizer. There are many things that can affect the amount of interaction in a conversion, like buying cycle or separate PPC landing pages. The examples below show the difference in interaction between a high-cost product without separate PPC landing pages, and a low commitment conversion with separate landing pages.
High cost conversion, without separate PPC landing pages:
Low commitment conversion, with separate PPC landing pages:
Channel interaction is incredibly important to understand for any PPC account. Knowing how these channels work together to create a conversion will help you better evaluate and optimize your PPC account and more accurately report performance to clients.
2. How much does PPC assist with conversions?
Why it’s important to know: You might not be reporting the full benefit of running PPC ads. Previously in Analytics, we could only attribute conversions to PPC if PPC was the last interaction. This meant that PPC ads, which are often the first interaction someone has with your brand, were not being given full credit for attributing to conversions.
You need to be reporting Assisted conversions as well as last interaction conversions to your client. In the example below, you can see that with just last interaction revenue, we were missing more than half of total revenue in which PPC was part of the conversion path.
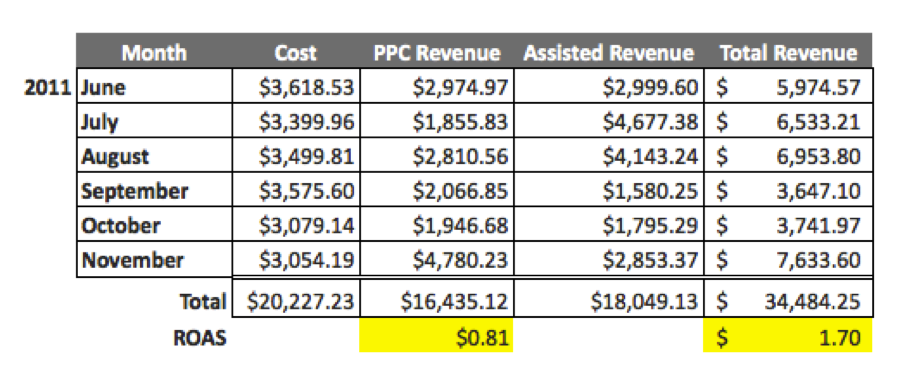
Let’s take a look at how assisted revenue can change the whole picture of PPC from one of our monthly reports below:
Before MCF, we could only report revenue that came from a last click PPC conversion. Based on this data alone, the account was losing money. For every dollar of ad spend, only $0.81 of revenue was being generated. Taking assisted PPC revenue into account, which accounted for more than half of the revenue generated in the last 6 months, ROAS increased to $1.70.
3. Which PPC campaigns / ad groups / keywords / placements have more assisted conversions than last click conversions?
Why it’s important to know: You could be cutting back on budgets or pausing campaigns, ad groups, keywords, or placements which appear to be “poor performing” in AdWords but are actually generating conversions and revenue.
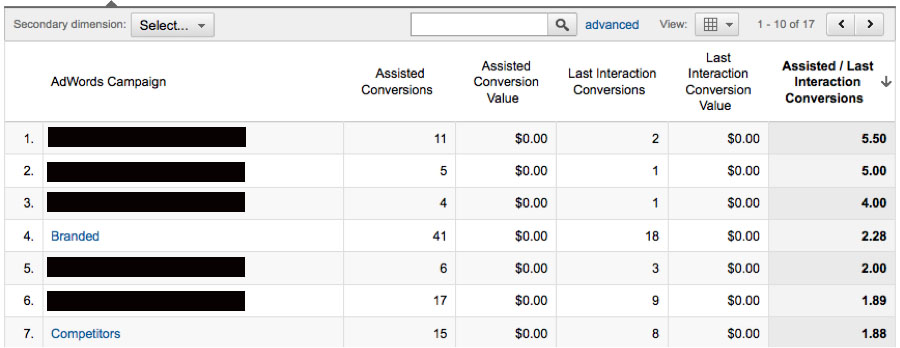
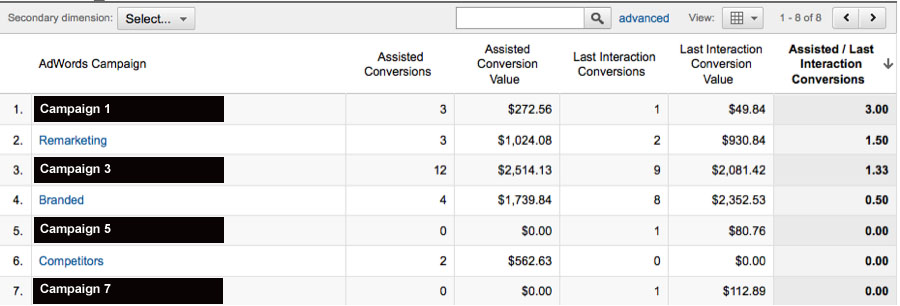
Go to the Assisted Conversions report and toggle to the AdWords tab. Sort your data by Assisted/Last Interaction Conversions to view the campaigns you are most likely undervaluing.
We’ll go over how to use this information more in the next section, utilizing MCF to improve PPC performance.
4. Are Branded Campaigns Taking Too Much Credit?
Why it’s important to know: You might unjustly consider some non-branded keywords, ad groups, or campaigns as under performing, when really, they’re contributing to the initial search that leads to a brand term conversion.
If you’re bidding on your branded terms, you might notice that they do spectacular in AdWords. It’s important to realize, however, that those conversions are often a part of a previous organic or paid click, then when the searcher is ready to convert, they search on your branded terms, thus, clicking a paid, branded ad.
Branded campaigns taking credit for the final click on searches that originally came in through another campaign or involved a click on a remarketing ad after the initial visit are pretty common. It’s good to know what areas are contributing so that you can see the true value of campaigns that may see a low conversion rate or high CPL.
To look at conversion paths which have Branded as the last interaction, go to the Top Conversion Paths report and make sure you are on AdWords. Then, create a new conversion segment to show only conversion paths which have Branded as the last interaction.
Once you save and apply the segment, sort by conversions and you’ll see all of the AdWords conversions that are being attributed to the Branded campaign. Below is a snapshot of 4 conversion paths where other campaigns initiated a conversion, but Branded was taking credit.
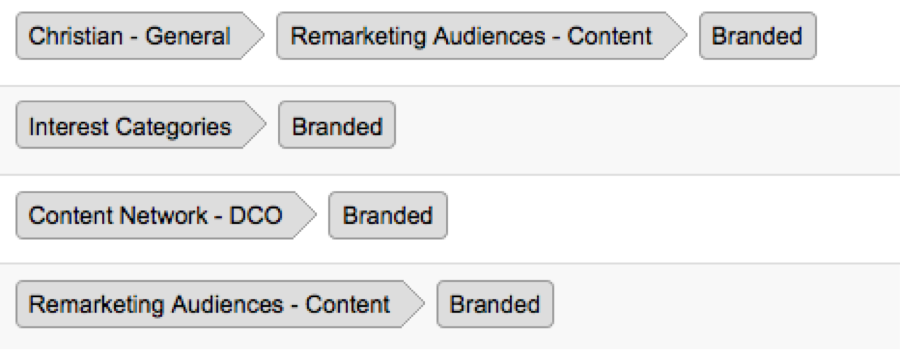 I can see that although my Display Network campaigns typically have a much higher CPL than branded, they are playing the important role of conversion initiator. Knowing this information is important so you don’t pause or limit campaigns that help spread brand awareness and lead to conversions for your account.
5. How long does it take for a person to convert?
Why it’s important to know: Money you spend in one month may continue to generate conversions in the following months. If your conversion requires people to spend money, it’s likely your conversion path will be longer than a day.
Looking at the example below of an e-commerce client, about half of the conversions occurred in the first day, but more than 30% took 12 days or longer. Also, these longer time lag conversions were much more valuable, account for about 68% of total revenue.
Don’t look back at November’s spend and conversion totals on December 1st and evaluate performance. If you have a time lag of more than just a few days per conversion, the money you spent on PPC will still be generating conversions or revenue for you in months to come. Looking at it the other way, a large sale last month might have come from a PPC ad clicked the month before.
Keep this in mind when running reports that cost to conversions in a month is not a one-to-one comparison. Money that you or your client has spent this month, may not show return until next.
Improving PPC Performance With Multi-Channel Funnels
Multi channel funnels are changing the way Internet marketers look at their data. You can now use this tool to attribute a conversion across several channels, or use it in the following ways to improve your accounts and see how your tests are panning out.
Find Valuable Keywords
You can use multi-channel funnels for analyzing keywords that convert well for you to use in your paid search strategy. Start on the Assisted Conversion report and toggle to the All view. Then move below the graph and set Viewing to Keyword.
Now you can start sorting based on value to find keywords that you may be missing out on. The top ‘Assisted Conversion Value’ keywords will show you keywords that are contributing to overall success, that you’ll want to audit against your current keyword list for more ideas. The ‘Last Interaction Conversion Value’ top keywords are your top “closer” keywords. Audit the keywords that show up in this list against the keyword list in your AdWords campaign.
Allocate Spend to Increase Conversions
If you are just setting budgets based upon conversions seen in AdWords, you may be limiting spend in campaigns that generate revenue. You also need to take into account the amount of assisted conversions your campaigns are generating when deciding where to allocate spend for your account.
Navigate to the AdWords tab in the Assisted Conversion reports and look at value by campaign.
Take this information and compare it to current spend in your AdWords campaigns.
There where two surprises for me when I pulled this report. I had been limiting budgets in Campaign 1 and Competitors because looking at only AdWords and Last Interaction Revenue, it appeared that I was losing money. Taking into account Assisted Conversions though, I can now see the value of these campaigns and have increased spend, especially in the competitors campaign.
You should also run this analysis at the ad group, keyword, and placement level to see if you are limiting spend on performing accounts elements.
Assess Display Network Placements
If you’re using automatic placements for the Display Network, you can use your assisted conversions report to find potential managed placements or to see if you’ve excluded placements which have assisted in conversions. To run this report, follow these steps:
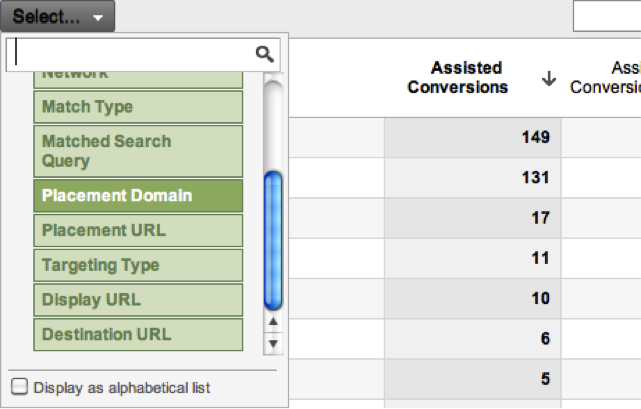
From your assisted conversion report, select a secondary dimension for placement domain.
Then, filter for your Display Network conversion segment. To create this filter, set a filter for anything containing “Content.”
 Now you can see all of the placements that have assisted or closed conversions in your Display campaigns.

Compare this list to your current exclusions and make sure you didn’t exclude a placement in AdWords which has lead to a conversion. If you have any high performing placements, consider adding these as managed placements to bid on them separately.


