
Basic metrics tell the story of paid search performance but what if you want to dig deeper? You’ll need to go beyond the basic segments and reports.
Segmenting data in new ways reveals new stories and allows you to leverage new insights. You can find new targeting opportunities, a new direction for your messaging, or the impetus to finally break a set of keywords into their own campaign.
In this article, we’ll work through a few samples that you can implement today. We’ll first cover two skills to analyze keywords and search terms and wrap up by bucketing keywords by performance contribution.
How Many Words Does It Take To Search?
Are users relying on generic header terms or are they more verbose? To answer this, we can calculate a count of the words per query or per keyword.
I’d recommend using queries as the primary focus. Query based data gives you a more accurate representation of actual searches.
Imagine what the data would look like if you included those one word keywords like boots, cars, or cats. You’d match to many queries all of which vary significantly from your selected keyword.
Counting Words In Excel
So how do you count words in a query? It’s easy enough, if not immediately intuitive.
What we need to do is trim the text string to remove extra spacing, count the length of the string, find the difference between the string with and without spaces.
Sound complicated? Think of it as a roundabout way to see how many spaces there are, which equals how many words there are. If it’s still a little fuzzy just use this formula and call it a day.
=IF(LEN(TRIM(A1))=0,0,LEN(TRIM(A1))-LEN(SUBSTITUTE(A1,” “,””))+1)
See this tutorial from Excel Jet for a more thorough walk through.
What To Look For In Your Analysis
Once we enter the formula can start sorting performance by word count. Do longer or shorter queries perform better? If we notice a major discrepancy in performance we can go back the data source, filter to that segment, and find the culprit.
Keep in mind which campaigns you include in your analysis. If you include brand terms, and your brand’s name is “Mike’s Grand Hot Dog Shack” you’re going to see performance heavily weighted towards queries with five words.
Using Google Analytics For Performance By Word Count
If you just need the top level data for AdWords only you can use the Query Word Count report in Google Analytics, you can find it under Acquisition>AdWords>Search Queries and swap your primary dimension.
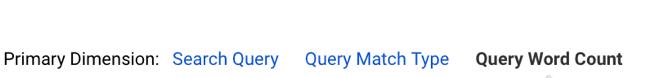
This won’t give you the same flexibility to explore the data but serves as a quick start if needed.
How Do Users Refine Their Searches?
Finding your best query variants allows you to leverage that performance as well as modify your approach as needed.
Choosing And Structuring The Data
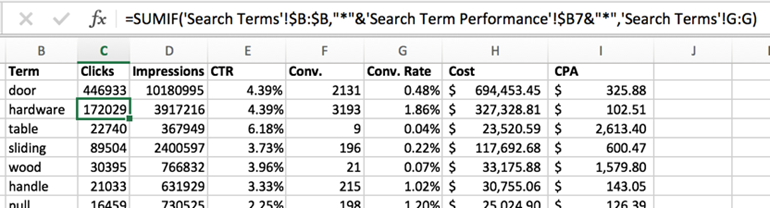
When deciding what to analyze, you can either use an n-gram analyzer or simply choose modifying terms yourself. Once you have them aggregate the numbers around them with sumifs.
Common examples include product features such as material and color. You could also compare service features such as quick, fast, or cheap.
As a hint, if your brand does not lean on competitive pricing, take a look at cheap and affordable.
What To Do With The Data
In a recent account audit, we found nearly 35% of traffic went to price related queries but only 9% of the conversions came from these terms. This is a major mismatch in investment and returns.
In this situation, you can either, bid down, add negatives, or create new campaigns and ad groups to address this segment. After all, 29% is a large chunk of traffic to cut completely.
Below is a breakdown of parts related searches for a custom home décor campaign. From this data we see many clicks for tracks. These searches have high CTRs but lower conversion rates than handles, which has similar traffic numbers but many more direct sales.
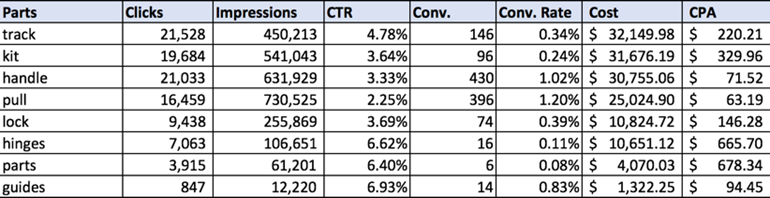
From here you could investigate the landing pages for track queries. The current pages could be too generic or hard to find the specific products. You could also dig deeper into the queries themselves. Are there certain track queries that convert more readily compared to others?
The opportunities are solely defined to paid search either. If you notice certain language predominates you queries, you could carry that language over to CRO for your landing pages.
Bucketing By Metric
You’ve probably heard of the Pareto principle. The principle states that 80% of output come from 20% of the investments. How does this apply to paid search?
The principle won’t quite match up to the same ratios but a small portion of your ads and search terms will deliver a disproportionate amount of the results.
Let’s dive in!
We’ll first start by calculating the portion of total cost for each keyword. We’ll then sort by descending cost to make the next step easier.
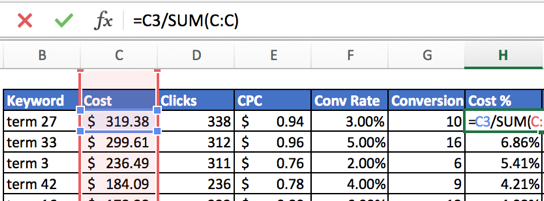
If we want to see how many terms drive the top 60% of total spend, we need to calculate the cumulative total contribution. We’ve already sorted by the top spenders, now we can calculate those summed percentages.
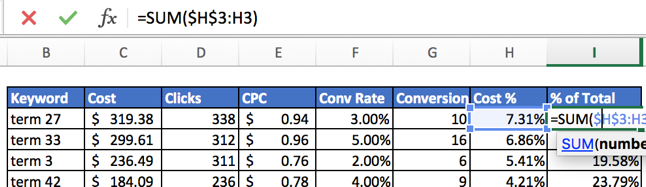
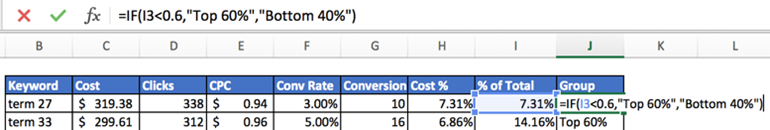
We can anchor that top cell and drag the formula down. We’ll use two options here, top 60% and top 40% and use an if statement to apply that label.
Now we can use a sumif or pivot table to put the data together.
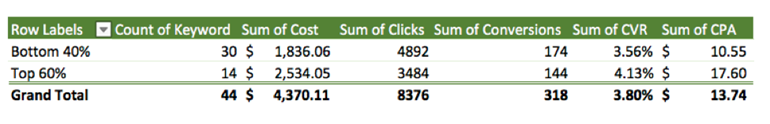
Based off the sample data about one third of the keywords generate 60% of the spend. The convert at a higher rate as well but have a higher CPA. As expected the more competitive terms can drive CPCs up leading to higher costs.
We can go back and adjust the percentages, ad more tiers, or dive into the actual data. Within that top 60% we probably have a handful of keywords that serve to drive up the CPA.
Conclusion
These three methods are some of the most common techniques for digging more deeply into paid search performance. Each one tells a slightly different story and reveals a different type of optimization.
None of these will be an endpoint in analysis but each will push you in a new direction and better understanding of your advertising performance.
