
To online advertisers, it has become very clear that Facebook (more often than not) needs to be a part of every digital strategy. Whether it is brand awareness, dynamic remarketing, or a basic static ad, Facebook Ads can be a key element in driving traffic and increasing conversions. However, if you have ever used Facebook Ads you know that seeing a high return on your efforts from a direct-conversion standpoint doesn’t happen often. Yet, we keep feeding money to Facebook because we as digital marketers know the value Facebook provides beyond those direct conversions (whether we can quite put it into words or not).
This is the point where I think many advertisers struggle – creating a case for Facebook in how it helps drive potential converters down the funnel. Making this case can be particularly difficult when dealing with those that do not directly manage the Facebook efforts such as supervisors, clients, etc. Granted, there are tons of articles that speak to coping with this difficulty, however, a majority of those speak more from a qualitative perspective. In this post, I’m going to show how to use Google Analytics to make a better, more quantitative case for paid Facebook efforts.
Everything You Need
Before we begin, here is a quick disclaimer. For this process to work (at least this way), you must have your Facebook and GA accounts linked. Furthermore, having an organized GA account is always a plus. Other than that, it is fairly straightforward. You’ll need access to the Facebook data, Google Analytics data, and excel. Plus, you should have a certain time period in mind. In this example, I’m using a client’s busy season, which is around five months worth of data.
Step 1 – The Download
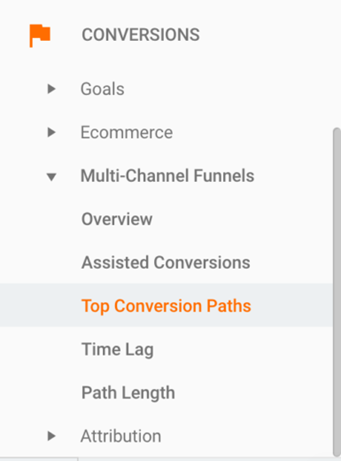
To begin, let’s start in Google Analytics. As shown below, navigate to “Conversions” and then “Top Conversion Paths.”
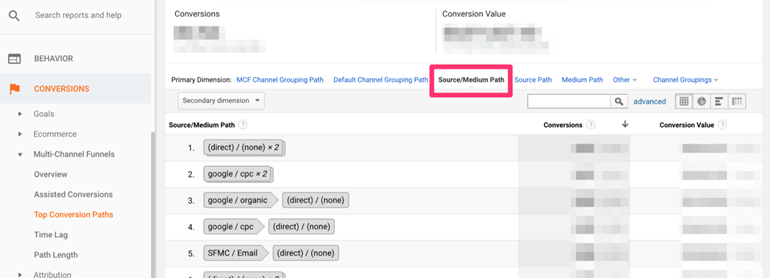
From there, select “Source/Medium Path” as your primary dimension.
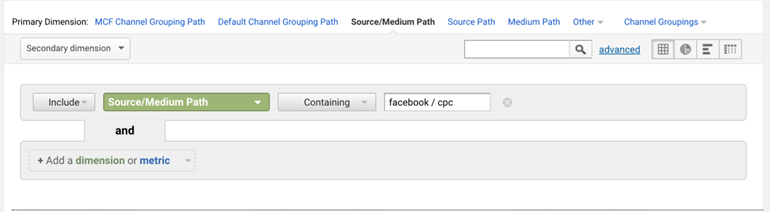
Next, we will want to filter our view to weed out any conversion paths that exclude Facebook. After selecting “advanced” next to the search filter, you should then set your filter to include Source/Medium Path containing “facebook / cpc” (this portion will vary depending on how you denote paid Facebook within your GA account). Here is an example.
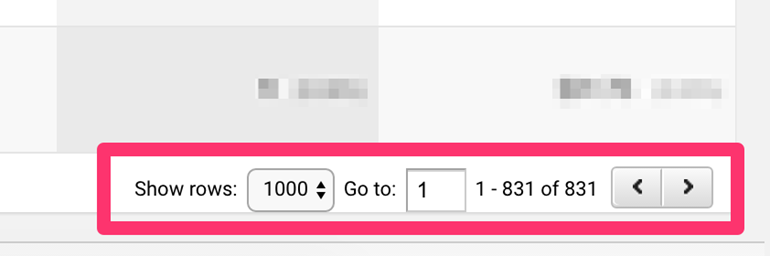
The last step before downloading is to make sure we get all of the conversion paths we need in the download. Navigate to the bottom of the page to determine how many different paths there are. In this case, I wanted to show 1,000 rows as there were 831 paths, (as shown below).
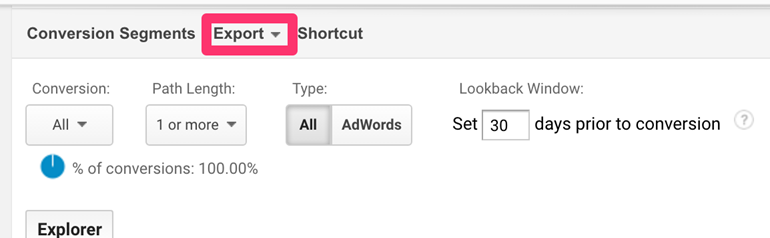
Finally, for the download, go back to the top of the page in Analytics. Before selecting “Export,” use the following settings.
- Use “All” conversions. (You can change this if there are certain conversion types you want to exclude.)
- Select 1 or more for your path link.
- For Type, use “All.” We use “All” to ensure we are hitting all of the touch points in our paid Facebook efforts. (Again you can change this as necessary)
- Finally, I used 30 days for the Lookback Window. This again can vary, however, 30 days was a good attribution window for this specific client.
Here is a visual of the above information.
Finally, export the data as a csv.
Step 2 – Sifting Through The Raw Data In Excel
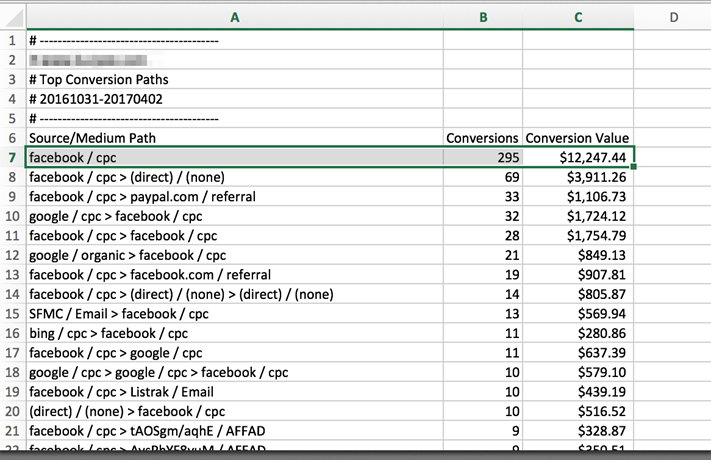
After opening the download in excel, the first step is to remove the single-path data. This will likely be at the top, but if not, you can search for it. In the case of my example, the Source/Medium Path name was “facebook / cpc.” Copy and paste single-path data elsewhere, and then delete it out of your raw data. Here is an example of the single-path detail.
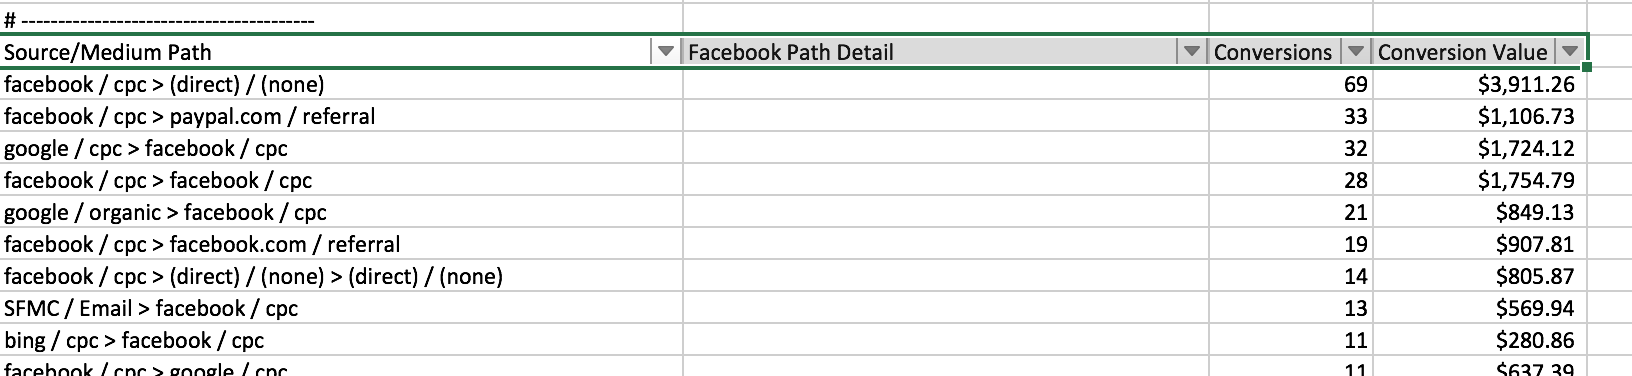
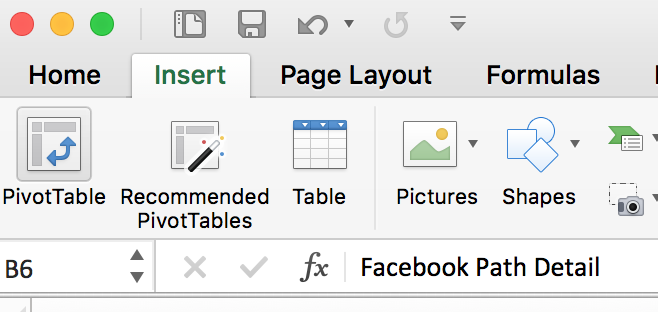
After removing the single path, add a column between “Source/Medium Path” and “Conversions.” Then, title that new column “Facebook Path Detail.” Next, add a filter to columns A through D, like so.
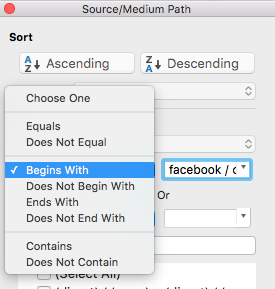
From there, filter Source/Medium Path using the following: “Begins with: “facebook / cpc”.
After that filter is set, title the displayed blank rows in column B with “Begins with Facebook.” Then, set your filter on the Source/Medium Path to “Begins with: facebook / cpc” AND “Ends with: facebook / cpc”. Title all of those displayed rows in column B with “Begins/Ends with Facebook.” This will overwrite some of your “Begins with Facebook” data. However, this is what you want to happen.
Next, you should filter the Source/Medium Path for “Ends with: facebook / cpc” and title the blank cells in column B with “Ends with Facebook.” This won’t be as easy as the first two times, as we do not want to overwrite any Column B row names at this point. Be sure to only title the blank cells here and leave the “Begins/Ends with Facebook” as is. However, I have a quick tip to get around this. While keeping the current filter on, add another filter on “Facebook Path Detail” and only select the blanks. This will then show all of the cells that you should name “Ends with Facebook.”
For the final step in the raw data stages, clear the two filters you just set. Then add another filter on Source/Medium Path by only selecting the blanks. At this point, title the remaining blank cells in column B with “Contains Facebook.” Finally, clear all filters and spot check the data to ensure there are no blank cells in column B.
Step 3 – Creating The Pivot
Now, we’re finally ready to start cleaning up the data. Select all of the data in columns B through D (do not include A), and then navigate to Insert > PivotTable.
After hitting “Ok” and adding your pivot table to a new sheet, you should set up your pivot field as follows:
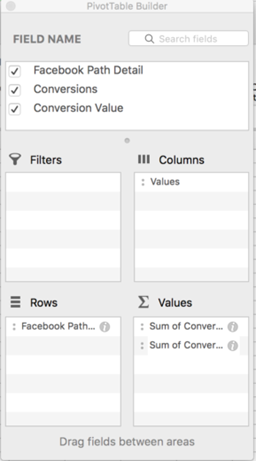
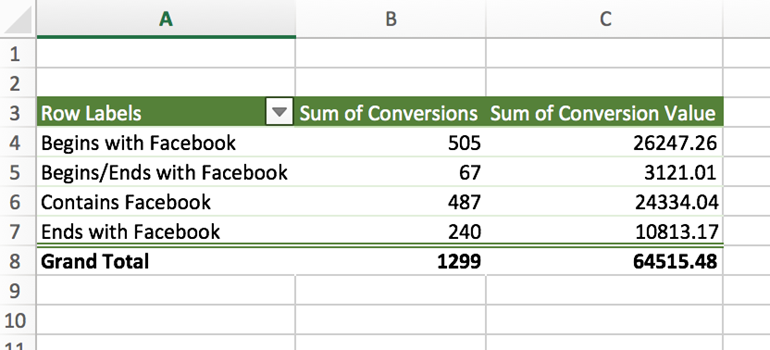
Place your fields as I have above, and then click back into your sheet. You should now see your data in a condensed view such as this.
Step 4 – Formatting The Data
This part is completely up to the user, but here is a quick breakdown of how I did it in this example.
- Copy your pivot table and paste values into a separate sheet. Add the title “Paid Facebook – Attribution (Multi-Path)”
- Remember the original single-path Facebook data that you stowed away earlier? Paste that next to your attribution data and title it “Paid Facebook – Single Path Conversions”
- Don’t forget to include the date ranges.
- Then, format the rest to whatever you prefer. Here’s an example of what I created.
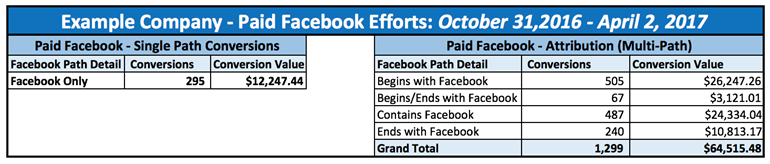
Here are some quick takeaways from the data in my final example.
- Facebook accounted for 505 conversions when a user saw a Facebook ad first
- (Excluding paths starting or ending with Facebook) A paid Facebook ad was a part of 487 different conversion paths
- In the 5-month time span, Facebook played a part in about $76.5k worth of revenue
Grabbing quick stats such as these will help provide a more clear understanding of what Facebook is doing for the account, especially when you can put numbers with it.
Conclusion
First and foremost, running this test does not mean it will make all Facebook data look good. But, it can be a great first step in determining how Facebook is playing into your overall digital strategy, whether that be a considerable amount or minimal amount. Also, this procedure is not exclusive to Facebook. Try testing this on other platforms, just be sure to substitute “facebook / cpc” in the process. Another point to consider is you are not limited to these metrics. I included the default to make the explanation a little simpler. However, feel free to add spend metrics, return metrics, engagement metrics, etc.
My main goal in this post was to provide some tips on how to arrive at some quantitative data for how Facebook actually plays into an overall digital strategy. This way should help take a more complex concept and simplify it into three basic metrics: Conversion Paths, Conversions, and Conversion Value. While the process can be a little tedious, the end result provides simplified data with the potential to make a large impact. Take this process, audit your own Facebook efforts, sell a client on increasing the social budget, sell your boss on increasing the social budget, and beyond. With a multitude of qualitative arguments for Facebook out there, hopefully, this post will help you place even more value on Facebook with some actual hard data.
