
When judging Facebook performance it’s easy to look at last click (or last non-direct click) data and assume Facebook isn’t performing as well as other platforms. It’s then easy to conclude that you should either reduce the budgets in Facebook or, worse yet, pull out of the platform entirely.
Yet, Facebook as a social platform with its rich media ad formats and a vast audience is a great tool to introduce your brand, product, or service to new people and it does perform. You just have to expand your definition and look at a variety of metrics.
So why is there such a focus on last click conversions?
It’s the easiest connection to make between your ad effort and the outcome you’re trying to achieve. Measuring performance this way gives you a very “clear” view of performance and makes it easy to make decisions regarding budget and optimization. The problem is that it oversimplifies human behavior, the customer journey, and how they interact with your ads. It discounts ad interactions that occurred before the last click and it potentially breaks the path that led people to finally convert on your site.
If you’ve ever done research on or grappled with the issue of attribution modeling you’ll be familiar with the amount of discussion and general confusion on how to best give credit to various ads in your marketing funnel (in summary, it hasn’t been figured out).
This isn’t an article on the issues and merit of various attribution modeling techniques and I haven’t solved the attribution modeling puzzle, but ignoring the fuzzy math behind it can cause you to miss performance where it does indeed exist. It’s also not only an issue in Facebook or social advertising as it can and does exist in paid search platforms (usually to a lesser extent).
What follows is a journey through Google Analytics and some basic ways to peek behind last click conversions to see how Facebook fits into your marketing mix. The data presented is from February 2016 and comes from an ecommerce account with $10,000+ of monthly spend in Facebook. We’ll be using Google Analytics to dig into Facebook performance for the purposes of this article, but the ideas will likely apply to other tracking platforms as well.
Using Google Analytics To See The Whole Picture
So what’s typically the first place that a person is going to look when assessing Facebook performance in Google Analytics on an ecommerce account?
Acquisition.
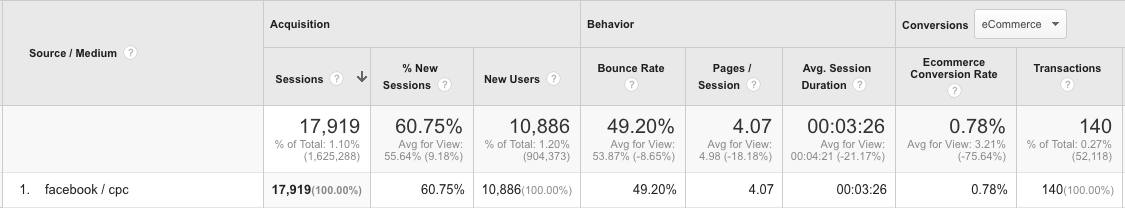
Here you’re able to look at how different platforms (including Facebook) performed from a last non-direct click perspective. Below, we see data from an ecommerce account.

The piece of data to focus on for our purposes is the 140 transactions that were attributed to Facebook. Even without knowing goals for this account, are we seeing the whole picture of Facebook performance?
Would you be comfortable making budget decisions or optimizations from this one number? Or is there a nagging feeling that there is more to the story than meets the eye?
One of the first places to go to dig deeper into your Facebook performance is to look at how many assisted conversions Facebook has.
In many cases, Facebook gets quite a bit more assisted conversions than last click. This data makes intuitive sense if Facebook is a platform where we introduce people to a brand that they might not have otherwise been looking for.
What does this data look like in analytics? Below, you can see assisted conversion numbers in comparison to last click conversions.

The key takeaway is that Facebook is generating just over 2 assisted conversions for every last click conversion. This means Facebook is actually helping other channels like email, paid search, and display garner conversions.
So what does this assisting of other marketing channels look like? Below is a small selection of conversion paths involving Facebook.
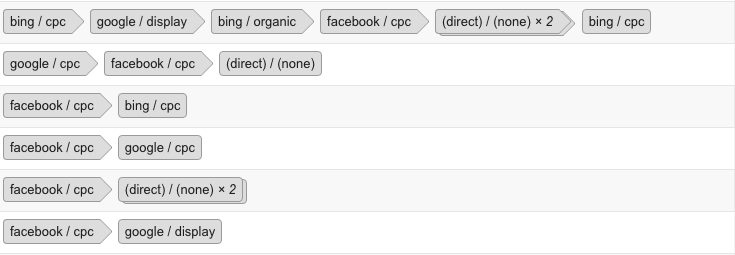
In these conversion paths, we can see that Facebook has been the start of a conversion journey that ended with a Bing Search ad, Google Search ad, Google Display ad, and direct conversions. It’s also played a role in the middle of a conversion path that started with Google Search and ended with a Bing conversion.
If we were to look at the full list of conversion paths that included Facebook we would see many more paths where Facebook either initiated contact as the first click or was part of a pathway between the first and last click.
Without these assisted conversions other channels would likely see a poorer performance. If we were to pause Facebook, we would likely see a decline in performance as it wouldn’t be feeding into these other platforms.
Conclusion
Doing these two additional analyses in Google Analytics will give you a broader understanding of how Facebook performs. Even more importantly, you can see how it is connected to your other marketing channels.
