
Loyal PPC Hero readers know that we’re big fans of the automation software Supermetrics. The product’s Google Sheets add-on is a powerful tool for PPC marketers to accomplish a wide-variety of tasks; from creating reports to automating bids and budgets, the tool allows digital marketers to work more efficiently and save a ton of time.
If you use the tool, you know that there’s plenty of flexibility offered through the add-on’s primary user interface, a sidebar that offers a step-by-step process for importing data that gives users the option to select numerous metrics and dimensions, and source the data from different date ranges and accounts. Digital marketing nerds can easily get lost in the sheer versatility of the tool.
For the vast majority of reports we set up and data sets we want access to, the side bar gets the job done tremendously. But in rare cases where the options in the side bar aren’t sufficient to accomplish the task at hand, it’s often possible to edit the Supermetrics query directly to unlock additional functionality. I’m going to walk through two use-cases where diving into the queries themselves unlocks some extra functionality and can save you even more time.
Use-Case Number 1: The Unusual Date Range Request
One of our clients requested a report that could update daily and would show month-to-date performance compared to the same period the previous month. We can imagine that this sort of comparison might be useful in cases where the client has end-of-month sales, or other regular events within a month that would have a significant effect on their metrics.
Let’s take a look at the date range options in Supermetrics and see how we might accomplish that. The date range at the top is the primary date range we want data from, and the drop down opened below shows the options we have for the comparison date range:
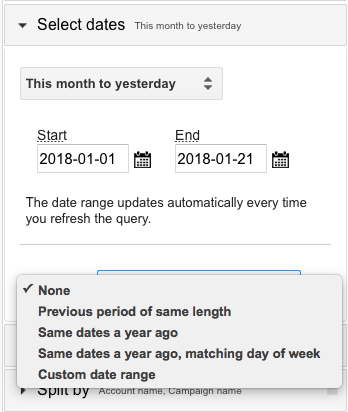
Hmm. It appears that we may have hit a roadblock. “Previous period of the same length” isn’t quite what we want – that will show the days immediately preceding our primary date range. The year-over-year data won’t satisfy the client’s request, either. We can select a custom date range and manually put in the dates we want, but then we would have to update it manually prior to every refresh.
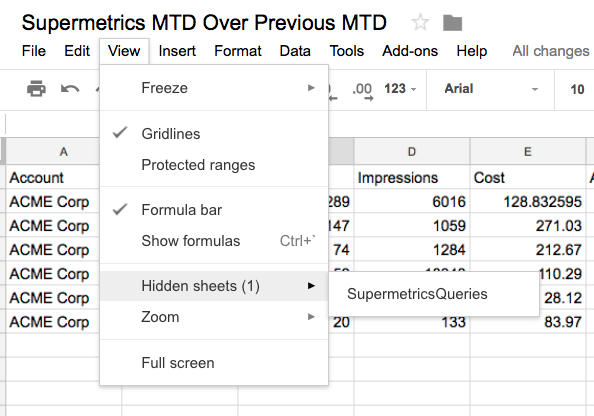
Luckily, the flexibility of Supermetrics Queries gives us a solution! First, find the Supermetrics Queries sheet. It is hidden by default, so if you haven’t already exposed it, you should be able to find it under the “View” dropdown then “Hidden Sheets”. You can also find the queries sheet by finding “Supermetrics” in the “Add-ons” menu and selecting “Manage Queries”.
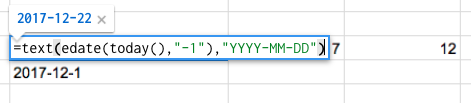
Now, let’s write a formula that will give us the date of the day one month ago. We can do this using the “edate” function, which displays the date a number of months before or after a date. The full formula (which will convert the result to the date formatting we need) looks like this – =text(edate(today(),”-1″),”YYYY-MM-DD”).
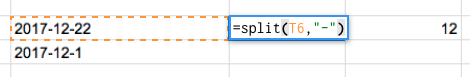
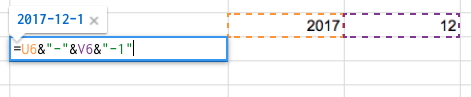
Now we can grab the date of the first of last month by using the split function to break up the values of the date one month ago. Once you have the year, month, and date split into distinct cells, you can use the append operator to create the date of the first of the previous month by substituting “1” in the day spot. The screenshots below illustrate this process in full.
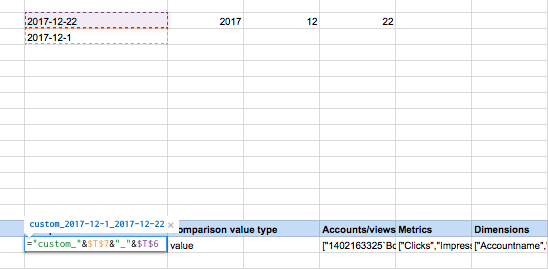
Finally, let’s go to the query itself to insert this dynamically generated date range. First, find the “Compare to” column. The syntax should be “custom_YYYY-MM-DD_YYYY-MM-DD” where the first date is the beginning of the comparison range and the last date is the end of the comparison range. Again, use the appender operator to replicate this syntax while referencing the comparison date range.
Refresh your query and voila! You’ve successfully updated your report to compare to the same period in the previous month.
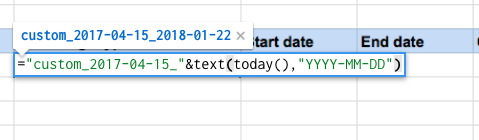
There are other cases where it can be useful to edit the query for custom date ranges. Imagine that you have a client that introduced significant changes to their account or business on a specific date. In a case like that, it may be helpful to import just data that’s accrued after that date, but up to the present. You can do this by editing the “Date range type” column like in the example below:
Use Case #2: Bulk Updates
Those of you who have worked with clients with franchises or multiple locations know that reporting can quickly become a challenge, especially if each location has its own stakeholders who appreciate detailed reporting. In cases like these, playing with the Supermetrics queries themselves can be exponentially more efficient than the alternative. Imagine that you’ve created reports with multipole queries for individual locations or franchises, where the only difference between the reports is the location or franchise that is being reported on.
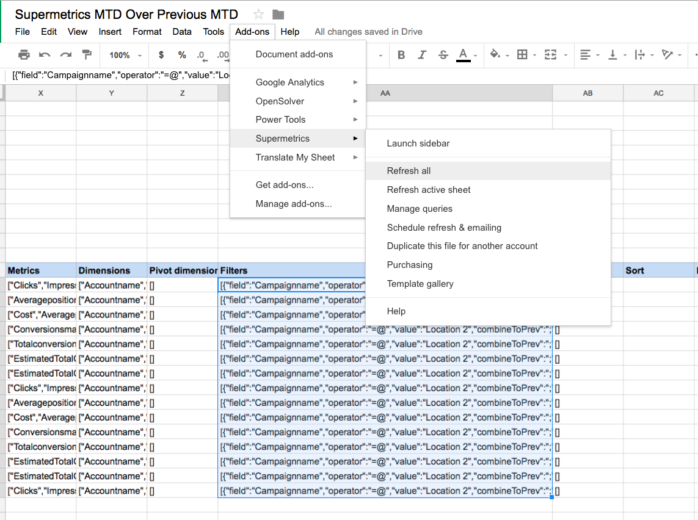
In cases like these, duplicating the template for the report and utilizing the simple “Find And Replace” feature can allow you to upload each query according to quickly create new reports for different locations or franchises. For example, in the screenshot below, we’ve got 15 queries collecting data for a report. We’re filtering the data for campaign names that contain “Location 1” to create a report for that specific location.
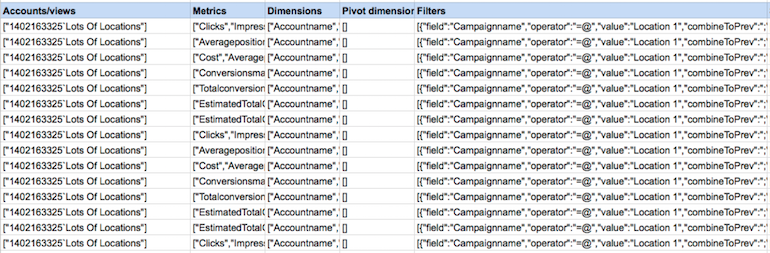
Let’s say we want to duplicate this report, but for “Location 2” instead of “Location 1” Rather than update each query separately via the sidebar, we can update the filter for each query at once by replacing “Location 1” with “Location 2” in the Filters column. Then, select, “Refresh all” and your new report will be created!
Wrapping Up
If you’re a Supermetrics user, you’ll likely find that once you start playing around with the queries themselves you’ll start finding new and better ways to use this already-powerful tool. Chances are, future posts will explore some additional uses, such as referencing data from drop-down menus to make reports more user-friendly and versatile. In the meantime, tweet at us with any new ideas or questions to @ppchero!
