
This question has come up a lot lately with PPC accounts that are expanding into Facebook Ads. “Why are my Facebook conversions higher than Google Analytics?” The problem is we are trying to compare Facebook conversions similar to how we track AdWords and Bing traffic, but it’s not the same.
When it comes to comparing conversions, it’s not that Facebook is necessarily over reporting or Google Analytics is under-reporting, they just are different. Below I will break down how Facebook and Google Analytics report conversions and tips for how to close the gap.
Why Conversions Don’t Add Up
When comparing conversion tracking across various platforms or 3rd party reporting systems, it’s fairly typical for conversions to be off by at least 10-15%. This is due to a number of factors including de-duping logic, where the pixels are implemented on the site, and a host of other issues. A few other reasons that prevent Facebook and Google Analytics from matching up include:
- Cross-Device – Majority of Facebook interaction is on mobile which is difficult for Google Analytics to track across devices and browsers
- Different attribution models
- Facebook counts multiple conversions vs. unique (1-click)
In addition, many 3rd party-tracking providers like Google Analytics use referrer URLs to credit conversions back to ads. Due to this method, these providers generally under-report Facebook conversions by about 40%. This is due to the fact that roughly 40% of Facebook users browse Facebook using HTTPS instead of HTTP. So when a user clicks a Facebook ad and converts on site, the referrer cannot be recorded since the user left an HTTPS environment and entered an HTTP environment. The other piece in why they don’t match up comes down to attribution and the default reporting setting for Google Analytics and Facebook.
How Facebook Reports Conversions
Facebook tends to be more generous with conversion tracking compared to Google Analytics when comparing the default models. Facebook default conversion tracking is as follows:
- 24 hour view through
- 28 day click through
Any comparison you do against other conversion reporting data should be within the same attribution model.
Facebook conversion reporting tips to keep in mind:
- Conversions are attributed to either a view through conversion or click through – never both
- Clicks take precedence over views
- Conversions are attributed to the most recent ad someone clicked or viewed.
- Any events outside the maximum conversion window (28 days) are not counted.
The Facebook conversion tracking process looks something like this:
Clicked ad from Facebook > Left site > Converted on website 3 days later
How Google Analytics Reports Conversions
Google Analytics only reports conversions that resulted from a direct referral. Even if you created a campaign using URL parameters to track the link used in your ad, Google only reports those conversions that happened in a straight line:
Clicked Ad > Converted
As I mentioned above, by default, Facebook counts view through conversions that happened within the first 24 hours where Google Analytics only tracks last non-direct clicked conversions.
How To Close The Conversion Gap
While it’s likely Google Analytics and Facebook will never match up 100%, below are a few tips for trying to close the gap.
- Customize Facebook attribution window
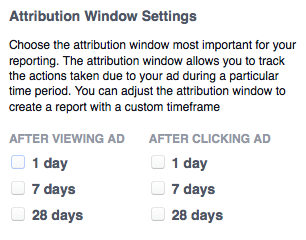
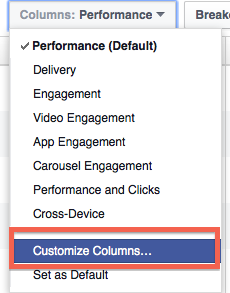
Updating the attribution window so that it more closely aligns with Google Analytics can help close the gap. For example, you can remove 24-hour view through conversions. You can customize the attribution window by going to:
Select Campaign > Columns > Customize Columns > Bottom Right Attribution Settings
Google Analytics
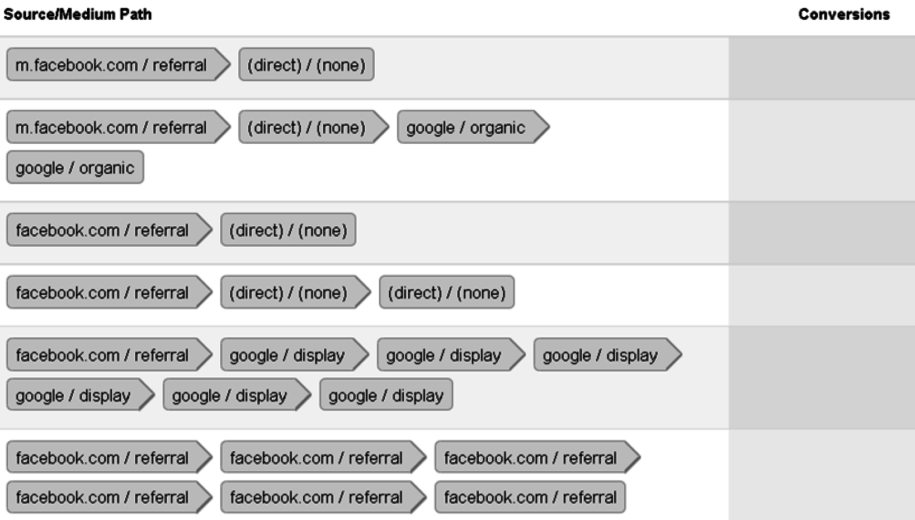
Review the Multi-Channel Funnels > Top Conversion Path reports to get a sense of how Facebook is actually supporting the funnel. Typically you will see that Facebook falls higher in the funnel – generally higher first click attribution.

From here you could use this information to potentially create a custom attribution model for Facebook. For example, you could test potentially a Position Based model which attributes 40% to the first and last touch points or look at creating your own custom attribution model.
Compare Conversion To Offline Data
If you have access to offline conversion data, understanding what percentage difference there is between offline data and the various platforms will also help you have a better understanding when it comes to optimizations. If you regularly track what percentage conversions in Facebook and Google Analytics are off by compared to offline data as the benchmark, this can also help to determine if there could be a potential tracking issue over time, helping you optimize and budget accordingly.
Closing Thoughts
Tracking is always a tough maze to navigate. If you don’t take the time to understand how each platform tracks and reports, you could be trying to compare apples and oranges. Understanding the attribution, timing and then customizing reporting to better align the platforms, can help close the gap and help you start comparing different types of apples vs. oranges.
