
As search advertising marketers, a big part of our job is finding and controlling inefficient ad spend. John Wanamaker put it quite simply when he said “half the money I spend on advertising is wasted; the trouble is, I don’t know which half.” The good news is that this isn’t the 19th century and we do have the tools to reveal where our ad spend is being wasted. Now, we all know the quick and dirty way to cut out inefficient spend: lower budgets, drop keyword bids or pause keywords based on some criteria. But what do you do when the problem seems campaign-wide or you’re already running a list of fully relevant keywords?
One method is to apply bid adjustments, also known as bid multipliers; but in order to intelligently leverage the power of multipliers, you first need to understand which areas of your campaigns are in need of a tune-up. Today’s topic is aimed at helping search marketers like yourself combat inefficient spend on a higher level via the study of dimensions. I’ll teach you some strategies for first zeroing in on inefficient dimensions of your search campaigns and then how to mitigate their impact, all with the help of every search marketer’s favorite tool: Microsoft Excel.
Part I: What Are Dimensions?
As a quick refresher, dimensions are the independent variables of your campaigns, the things that you can manipulate in order to affect performance. While the below is not an all-encompassing list, it does cover a large majority of the rocks you can turn over as you analyze your campaigns:
- Time and Date:
- Hour of day (12:00AM)
- Day of week (Sunday)
- Week of month (first week)
- Month of year (December)
- Seasonality (Winter)
- Geographic location:
- Country (United States)
- State (New York)
- Metro area (New York, NY Nielsen DMA®)
- City (New York)
- Website URL (Bing and Yahoo! Search Properties Only)
- Destination URL (landing page with 3 form fields vs landing page with 4 form fields)
- Device*:
- Type (Smartphone)
- Operating System (Windows)
- Demographic
- Age (18-24)
- Gender (Male)
- IP Address (167.220.24.27)**
*As a note, Bing still supports the ability to target campaigns by device type as well as operating system.
**IP address is not discoverable through standard reporting and is listed only as an exclusion option
Part II: How Do I Optimize my Campaign Dimensions?
When preparing to run a dimension analysis, it’s helpful to have top of mind some of the levers that you can pull in order to affect change:
- Cater specifically to a dimension – Create ad copy that speaks directly to searchers from New York City, separate campaigns by country for tighter budget control, find or create landing pages specifically for people searching to buy a gym membership after New Year’s versus the beginning of summer…. There are many ways to optimize for each dimension – once you’ve found one to work with you can really let your creative side shine!
- Apply a bid multiplier – with enhanced campaign parity, Bing Ads allows you to apply a wide multiplier range, from -90% to +900% for most dimensions, providing plenty of flexibility. As a note, unless your sub-dimension is an extreme underperformer, you should try a bid multiplier before resorting to exclusion. After all, we search marketers are optimization scientists seeking controlled progression rather than chaos, and the more drastic the change you make, the more volatile your results may become.
- Exclude or shut off a dimension – if your dimension just will not improve and you’ve reached your wits end, you can choose to exclude or shut off all traffic from that dimension.
Part III: The Nitty-Gritty
Now that we have an idea of where to look and what to do, let’s dive in and get to work with the heavy lifting! In this next section, I’ll walk you through analyzing two specific dimensions using real live campaign data!
Hour of Day
Depending on the type of business you’re running, one of the best places to start is the hour of day dimension. If you’re running an e-commerce campaign selling Broadway show tickets, clicks from the very early morning may not have as high a conversion rate as those coming during the afternoon or evening. Or, if you’re running a campaign selling video game-related products, the wee hours of the night may be the perfect time of day to advertise! It’s good to have assumptions, but the only way to know for sure is to ask the data whether your hypothesis plays out or not. The devil is in the details!
- Download the data and make sure that you have your desired metrics selected (clicks, CPC, conversions, CPA, etc.). In Bing Ads, you can do this one of two ways:
- Run a report of your choice and select hour of day in the unit of time drop-down box.
- Click the dimensions sub-tab and select hour of day in the time drop-down box.
- Open the datasheet in Excel and pull all the data into a pivot table.
- Set your dimension (hour of day) as the row and place your desired metric (CPA) in the values field. *Note – if you’re aggregating data (such as pivoting keyword-level data at the campaign level), be sure to create a calculated field for your pivot table (learn how to do this here) for best results.
- To make it easier to analyze the data at a glance, add conditional formatting. Highlight your primary metric’s column (make sure not to highlight the sum total at the bottom, which can skew the formatting), click conditional formatting and select the 3 color option for a heat map view. Keep in mind that some metrics may necessitate reverse heat map patterns, where the lowest number is green (e.g. CPA & CPC).
- Now that you’ve turned the data into a visual story, you can easily determine whether there’s a correlation between the hour of the day and performance!
Here are a couple of different, client datasets:
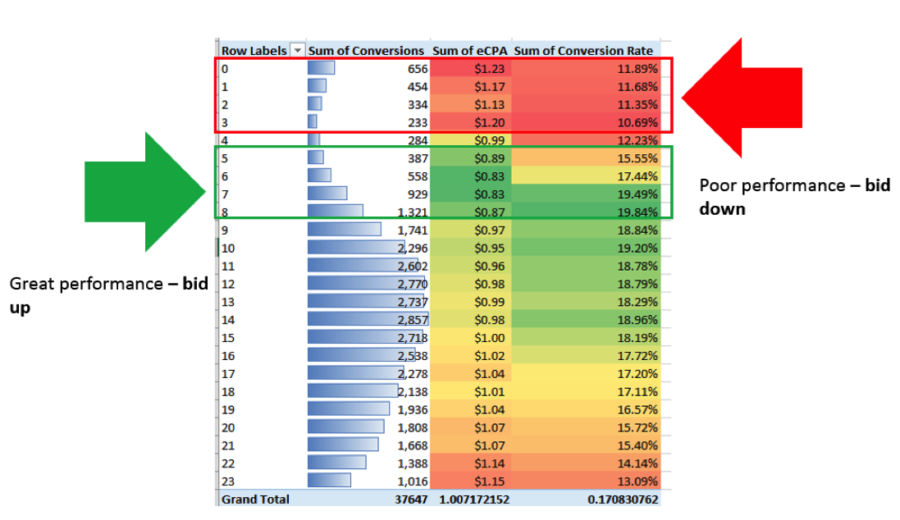
- For Client #1, the early AM hours perform quite poorly, while the morning hours of 7 and 8 perform very well.
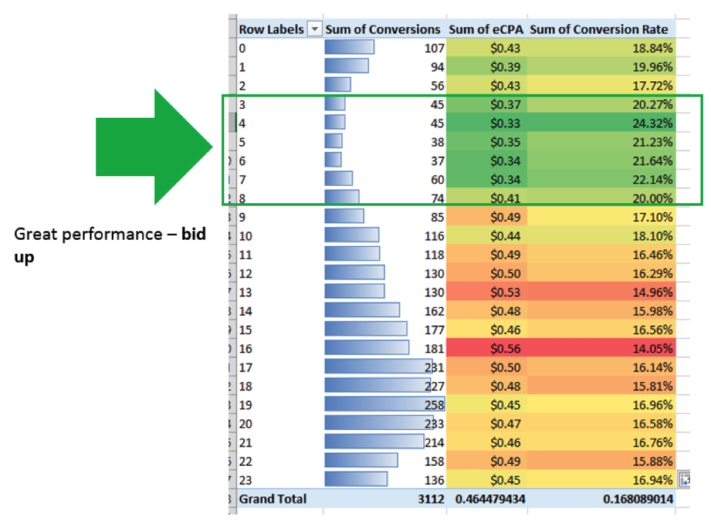
- For Client #2, these early AM hours do very well yet conversions are low, implying an opportunity to increase conversions through optimization.
Client #1
Client #2
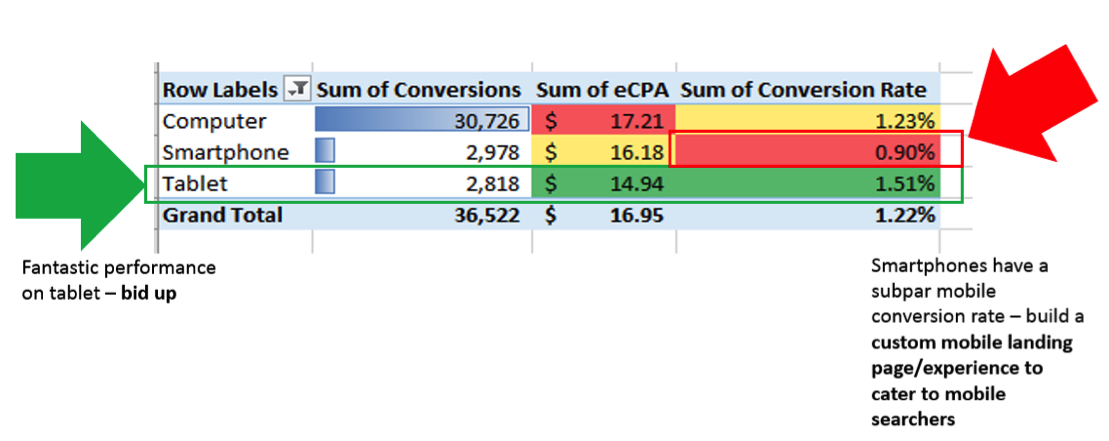
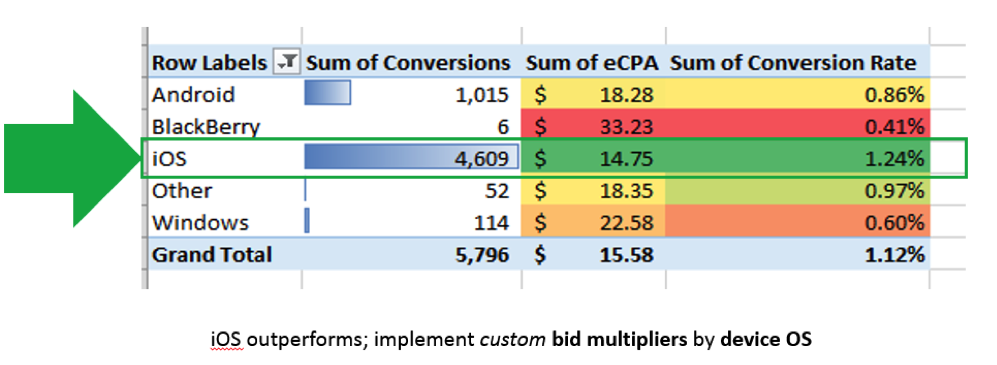
Device Type & Operating System (OS)
Taking a look at device type as well as operating system is also a great optimization tactic. Here are a couple examples of how drilling down into the device type and operating system dimensions can yield fruit.
Part IV: But Wait, There’s More
Lastly I would like to leave all you search marketers with a few caveats to take note of when running dimension optimization analyses. Even though you’ve made some discoveries that would make John Wanamaker proud, it’s important not to become too overenthusiastic and make a change that cuts either the wrong area or slices too deeply.
- One Size Doesn’t Fit All:
- Performance may vary significantly for the same dimension across different campaigns or product categories, so make sure that you’re running a report on a homogenous account, campaign or ad group. For example a campaign selling airport shuttle rides vs one selling limo rides may show significantly different results across the time of day dimension since they cater to different customer types.
- Make Sure to Use Enough Data:
- When running a dimension analysis (or any analysis for that matter), it’s also important to make sure that you have a wide enough dataset to be confident in your observation. Try running the analysis with a week or months’ worth of data to increase your confidence level. For example, if you run an analysis on a campaign for apartment listings, performance at the beginning of the month may look much different than the same analysis run on the same campaign but done in the middle or at the end of the month – run the report for an entire month to normalize the data.
- Be Mindful of Attribution:
- When viewing data on a time period basis, it’s also important to keep the concept “earned” vs “realized” conversions in mind. Earned refers to the practice of recognizing a conversion when the click that lead to the conversion happened. Realized refers to the practice of recognizing a conversion at the moment it occurs. In Bing Ads, the hour of day report will show conversions realized during a time unit. So, if someone clicks your ad at 7AM but doesn’t convert until 8AM, your conversion will be earned at 7AM and realized at 8AM.
- As Always, Know How To Reverse Course:
- When implementing a dimension optimization, be careful to double check your work and note what your settings looked like beforehand. Dimensions can be powerful since they affect all entities within the campaign or ad group you’re applying a change to; if you make a mistake or your hypothesis turns out to do more harm than good, you want to have the ability to revert your campaigns as quickly as possible. The Bing Ads change history report is a handy, graphical tool that makes it easy to tell at a glance which changes you made, on which dates to which entities, and also helps you discern how your changes affected your account performance.
Thanks for reading and happy optimizing! Stay tuned for my next article and in the meantime I encourage you to connect with me and reach out with questions and comments!
