
Last month I reviewed a new metric based off of Auction Insights, Rank Above Share. This month we have an updated version of diving into Auction Insights to find who your true top competitors are in search. Let’s go ahead and review what statistics are available to us when downloading an Auction Insights report:
Impression Share – How often the participant receives an impression in the same auctions that you are eligible.
Average Position – The average placement of a participant’s ad when they receive an impression on the auctions you are eligible.
Overlap Rate – How often a participant’s ad received an impression while you also received an impression.
Position Above Rate – How often a participant’s ad was shown above yours when both your ads were shown.
Top of Page Rate – How often the participant’s ads show at the top of the page in the auctions you are eligible.
Outranking Share – How often your ad showed above the participant’s ad or showed when the participant did not show at all.
Utilizing Impression Share multiplied by Position Above Rate is a good start at getting to the true competitors within your auctions in terms of who is ranking above you in your auctions. However, there is an even more precise way of going about finding these top competitors by using a few simple formulas off of the numbers we already have.
Here are the steps that were followed to come up with the true competition metric:
- Find who ranks above us when we are showing in the auction and combined that with how often we are both showing in the same auctions compared to the amount of auctions we are eligible for. Essentially what this shows is how often your ads show with your competitiors and your competitor is above you, divided by the total amount of auctions available.
- The next step we want to take is finding out how often our competitors show in auctions that we are not showing in, as this is another way that a competitor ranks above you, and actually shows what competitors are stealing your impressions. The metric we are looking for here is the amount of auctions in which the competitor shows, and our ad does not divided by the total amount of impressions we are eligible for.
- The final step would be to add these numbers together to see how often the competitor is ranking above us in all auctions we are eligible for with our keyword set.
So, let’s go ahead and get started with step one. There are a few ways to go about getting this metric. The first way is by taking your impression share, and subtracting the outranking share metric related to the competitor. For example if your Impression Share is 80% and your outranking share on a competitor is 40%, then that competitor outranks you 40% of the time when you are in the auction. You can get this same metric by multiplying your impression share by the position above rate and overlap rate connected with that competitor.
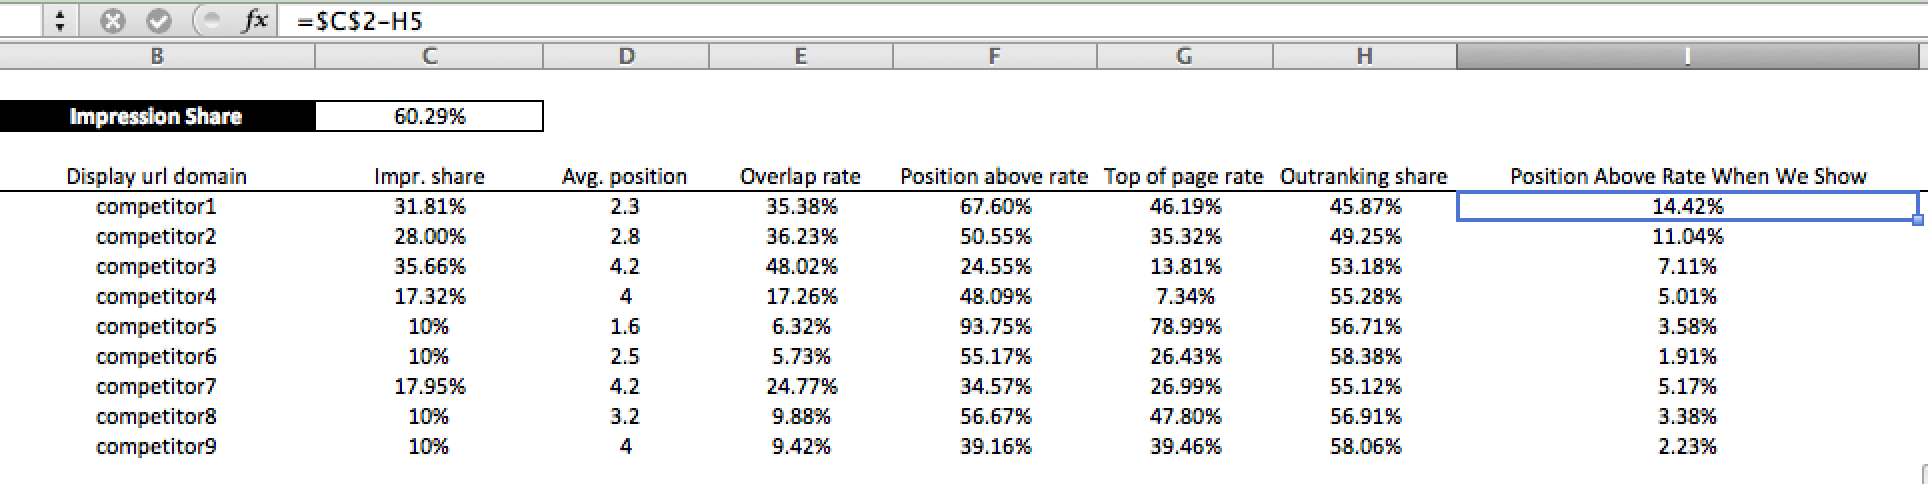
Below is utilizing Your Impression Share – Outranking Share to get how often your competitor is ahead of you in auctions where both your ads show:

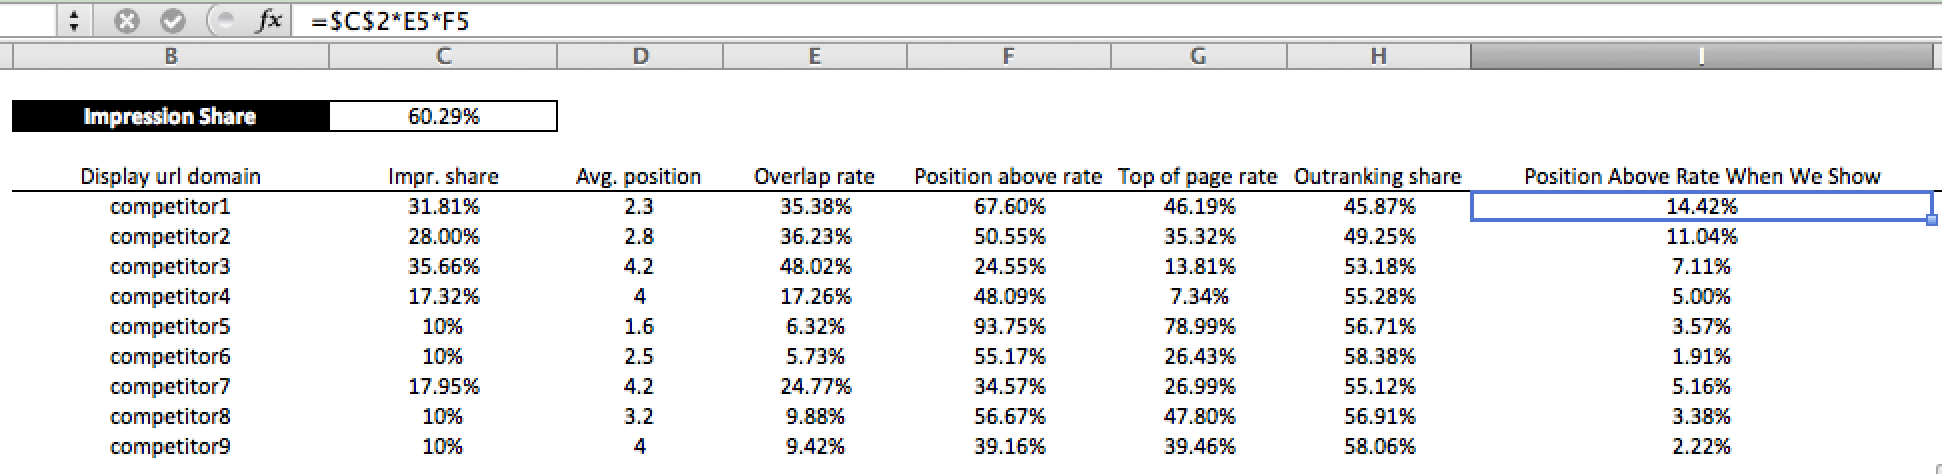
Below here we get similar numbers when using the Overlap Rate x Position Above Rate x Your Impression Share across all of the competitors in your auction insights report:
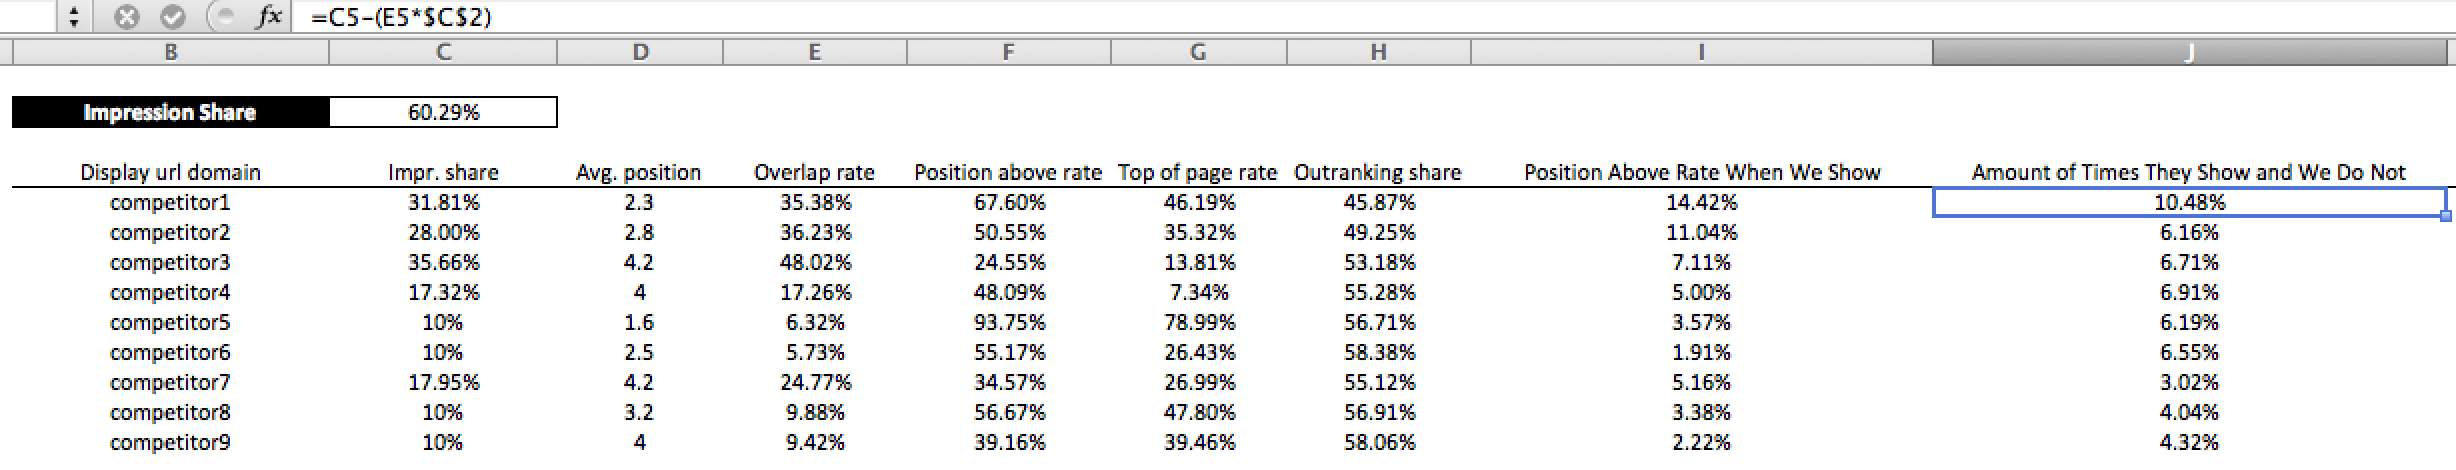
The next step is to get the percentage of time out of all available auctions that your competitors show an ad and you do not. The way to go about this is to take: Your Competitors Impression – (Overlap Rate*Your Impression Share). This allows you to eliminate the auctions that you and your competitor are in together. Overlap Rate shows how often the competitor shows when your ad also shows, and if you multiply this by your impression share it takes the total amount of times you and the competitor show together in percentage to all available auctions. From there, you can take this metric off of the competitors impression share, to see what percentage of that impression share comes without overlapping with your ads. Giving you the percentage of time a competitor shows an ad and you do not.
Below is an example of step two in the auction insights deep dive analysis:
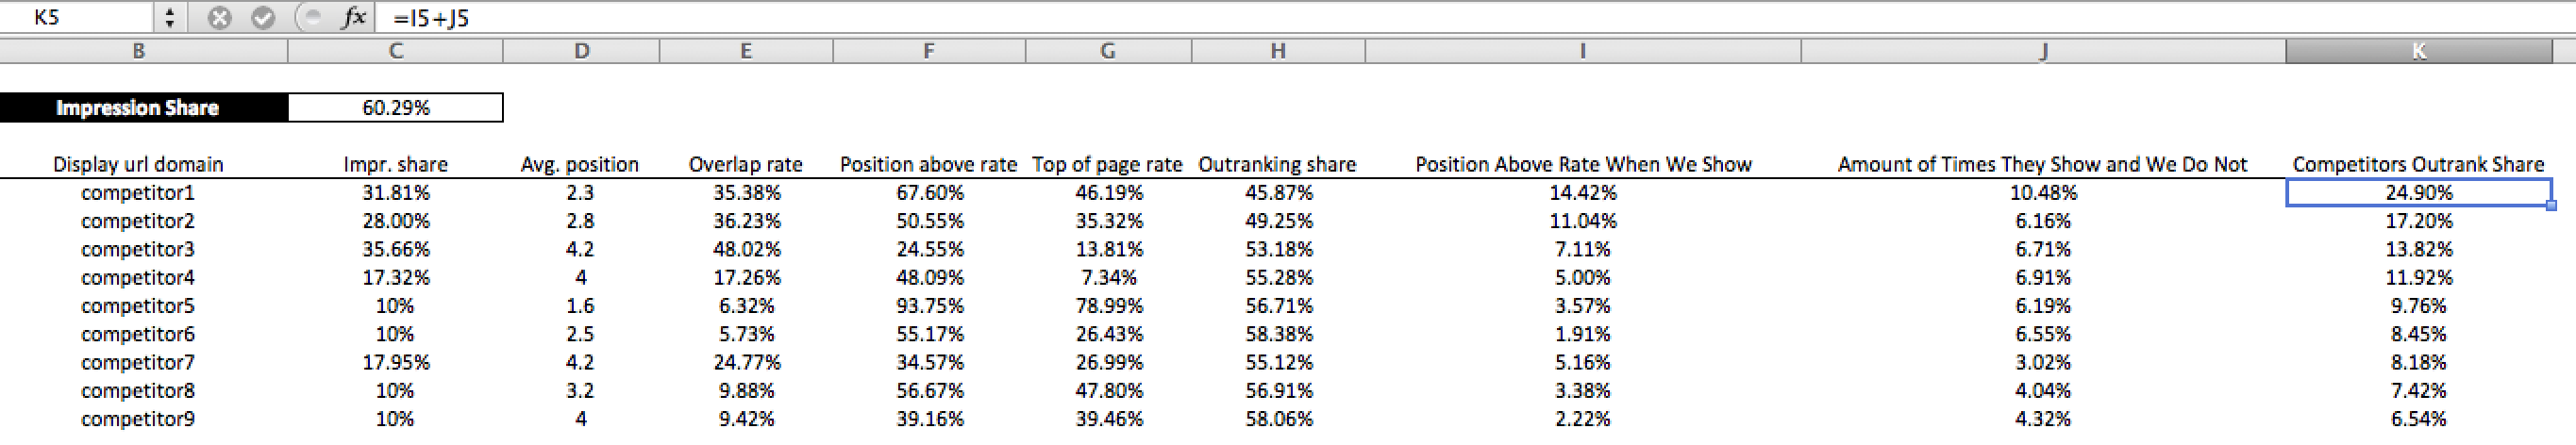
From here there is just one final step. Adding the two metrics together. Adding the metrics together will show how often a competitor ranks above you in all auctions you are available for (of course auction insights are typically not based off of all available auctions, so the numbers are estimates in most cases).
Below shows the chart after the final step:
Analyzing things this way can help show your true competition in terms of what competitors are a threat to your positioning and impression share. But this is not the only way you can use this data. Look at this data at a month-over-month set up to see which competitors are getting more aggressive than you, and which competitors are dropping out of the auctions (or atleast dropping behind your ads).
Another way you can look at things is if your impression share is up, but your average position is down, you can see if this aligns with the “Position Above Rate When We Show” and “Amount of Times They Show and We Do Not” metrics to see if in total across all competitors if the “Position Above Rate When We Show” went up, and what competitors caused this, and look into if “Amount of Times They Show and We Do Not” went down, and what competitors dropped here to allow us to enter more auctions. Obviously, this can be done in reverse as well when Average Position improves, but impression share moves in the other direction.
In conclusion, it is always a good idea to keep an eye on the competition. Utilizing these formulas is the best way to go about viewing the competition in different ways to see who the true competition is, who is costing you positioning, who is costing you impressions and once you find this, research the competitors to see how your companies align in terms of product prices, promotions, ad copy focus and much more.
