
As we move closer to the Holiday season, Google continues to come out with features to help eCommerce advertisers during their busiest time of the year. Two announcements were made by Google on Wednesday.
- The new Diagnostics tab in the Merchant Center will be replacing the Data Quality tab currently in the Merchant Center.
- Five new features around Shopping Campaigns have recently been launched to help advertisers rev up their campaigns heading into the holiday season.
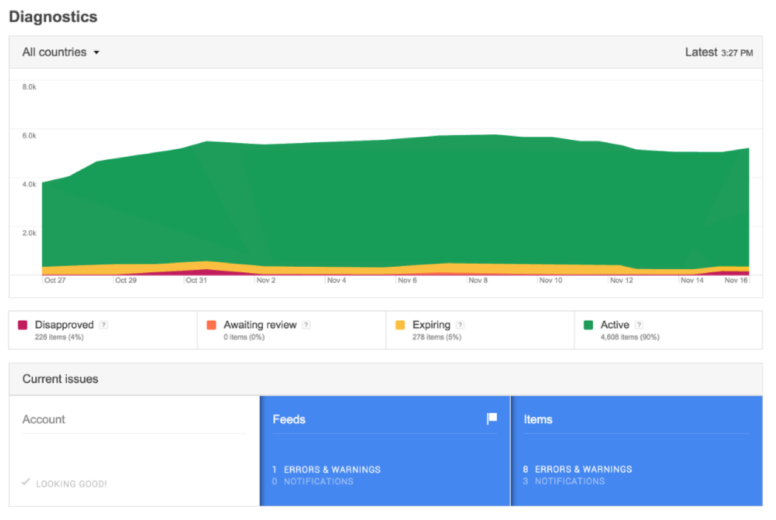
Google explained that with the new Diagnostics tabs, troubleshooting in the Merchant Center will be much easier for companies. Errors and warnings on your products feeds and items are easier to find with the Diagnostics tab as seen below:

The Diagnostic tab also gives users:
- A historic report in order for the user to see when/what may have caused the disapproval of items or feeds.
- A downloadable report giving the reasons for the disapproval of each item or feed that has errors or warnings.
- Traffic and impact metrics in order to see what the issues have done to overall traffic and performance.
Google did not stop there. New ways to look into Shopping campaign statistics have also arrived. The following five features are now available to advertisers for Shopping Campaigns:
- Auction Insights Reports – Wonder if you have the same competition on the regular Search Network with your Shopping Campaigns? Find out what competitors are showing when your Shopping Ads show. This can even help your companies pricing for online products, as you can see where you can get the edge on your competition as holidays approach.
- Search Impression Share – The dimensions tab now allows advertisers to get granular with impression share metrics in order to find where you are missing out on impressions due to rank, and where you are missing out on impressions due to budgets.
- Device and Time Segmentation – This allows users to see which devices and at what times their shopping campaigns are performing.
- Bid Simulator Columns – This shows the projected metrics an advertiser would see had they been bidding differently.
- Flattened view of your product groups – Allows you to sort product groups within a single ad group by performance data in order to help with optimizations.
