
Over the last few months, I’ve written articles on how to best visualize who your true top competitors are by finding rank above share to estimate who is showing above your ad or pushing you out of auctions.
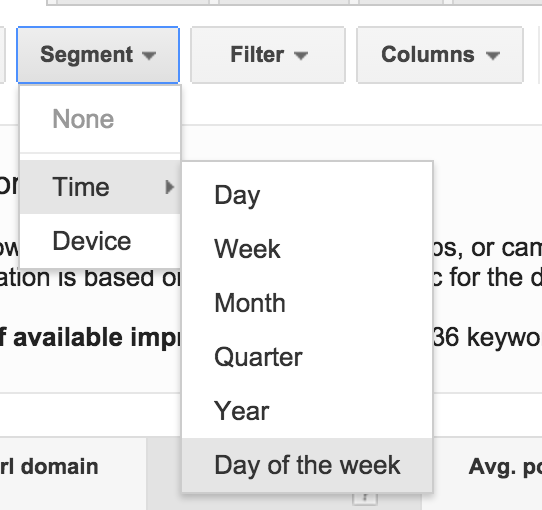
When digging into Auction Insights in the AdWords interface (Details > Auction Insights) you are able to utilize segments, with time and device as the options of segmentation. When looking into time data, sorting by the day of the week over a long time frame can show extremely helpful data as to which competitors are aggressive during what days of the week.

In order to do this, first download the Auction Insights with the day of week segments in place. This will bring a raw data sheet into excel with columns for:
- Day of week
- URL domain of competitor
- Impression share
- Average position
- Overlap rate
- Position above rate
- Top of page rate
- Outranking share
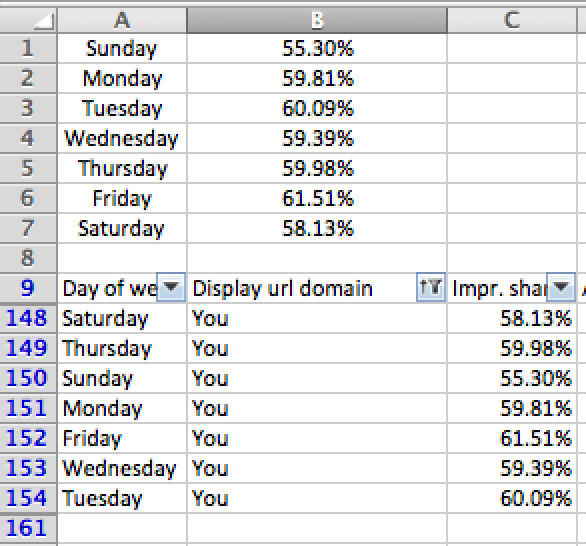
Typically a find and replace of < 10% with 10% in the impression share column is needed in order to do the analysis. Then, filter the URL domain column with “You,” so only your numbers are showing in the raw data sheet. Add eight rows across the top and show the days of the week in column A, and fill out column B with the impression share you are showing per the auction insight data for each day of the week as seen below.
The next steps will be to come up with the position above rate when both your ad and competitors show, along with the percentage of time your competitor shows and you do not. Then when these numbers are added together you get the rank above share, or the percent of time the competitor is dropping you down in an auction.
In order to get the position above rate when both your ad and the competitors show, the easiest formula is impression share minus outranking share. This was seen in the previous Auction Insights article. However, in order to do this by day of week, the formula is longer. With the setup seen in the image above you can start using the formula shown below.
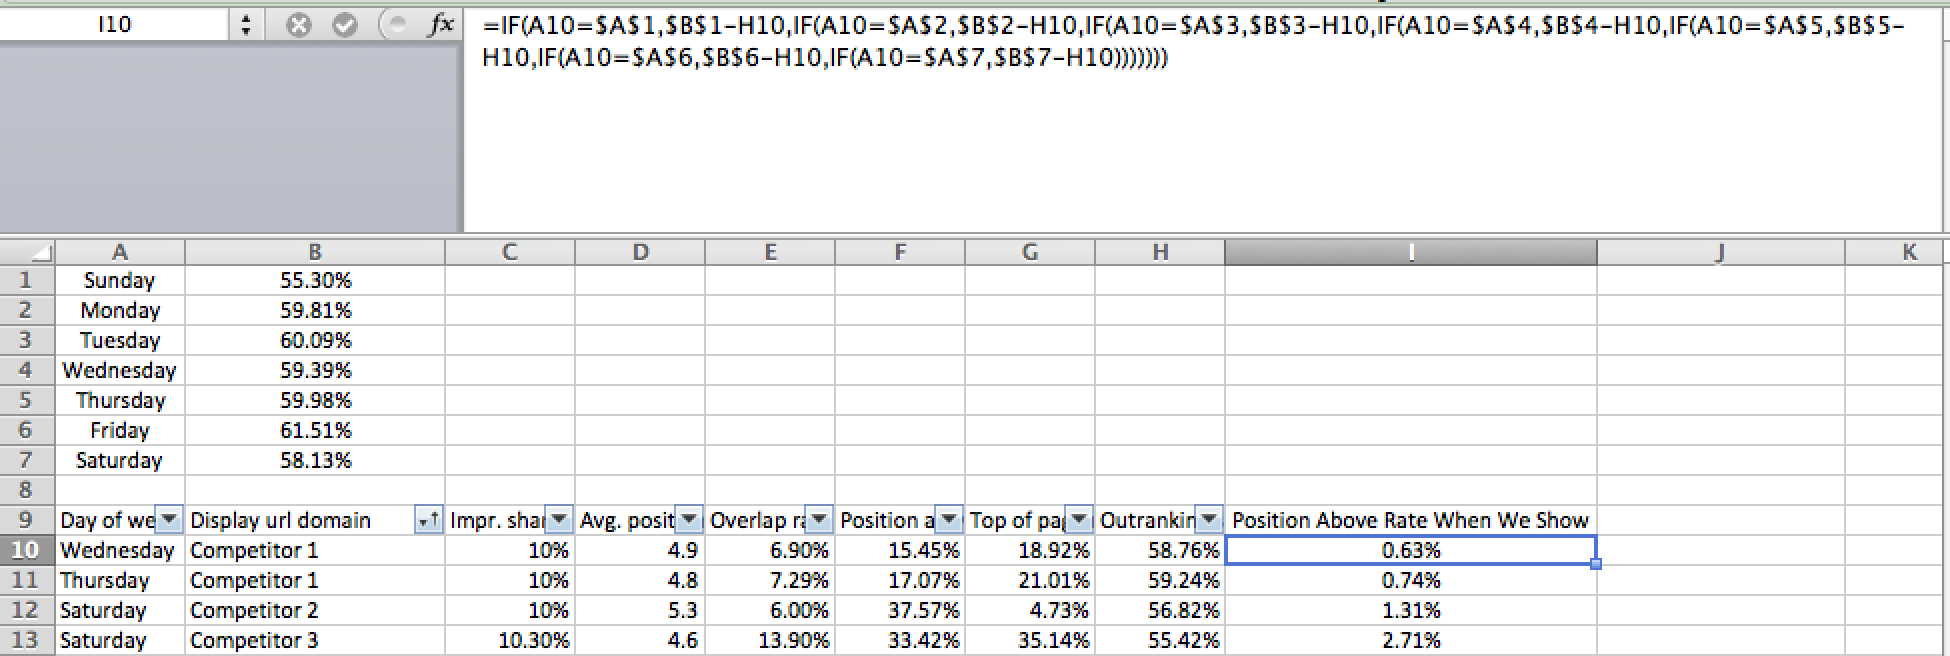
This formula essentially looks to find the match for the day of week and then utilizes your impression share for that day of the week when developing the formula of your impression share minus outranking share.
Once complete, the next step is to develop the formula for the percent of time your competitor shows and you do not. In order to get this percentage the formula that needs to be used is:
Competitors Impression Share – (Your Impression Share*Overlap Rate)
As per the position above rate when both you and the competitor are showing, you have to do the same with finding the correct impression share to use according to day of week as seen in the formula used below.
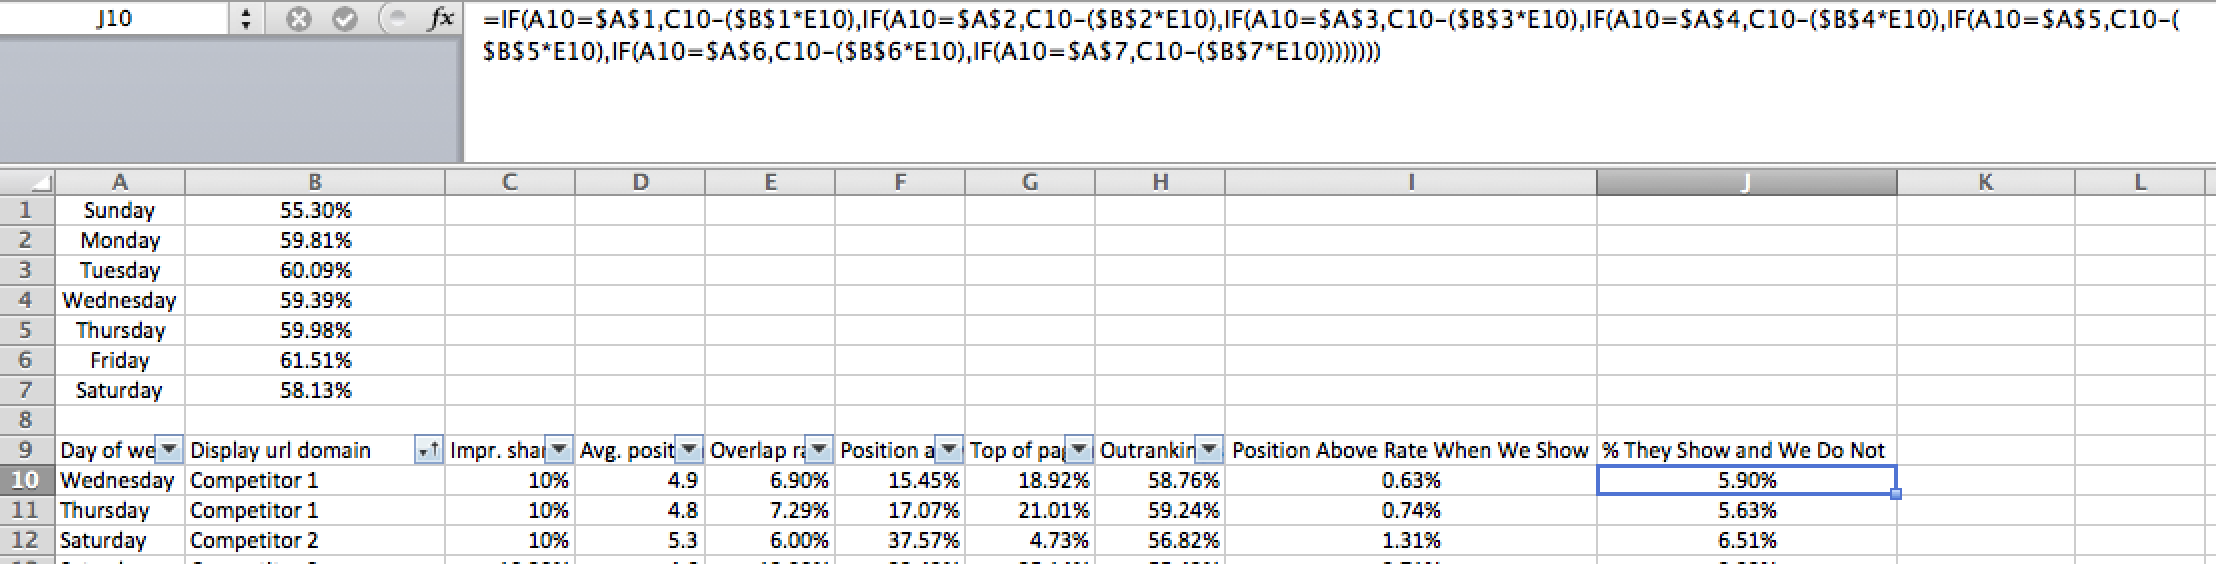
Just as seen in the previous formula, this formula will align the day of week with your impression share on that day of week.
Once this is done you can create one more column, adding these two numbers together in order to see how often the competitor is pushing your ad down in the auction. Here’s how that step looks.
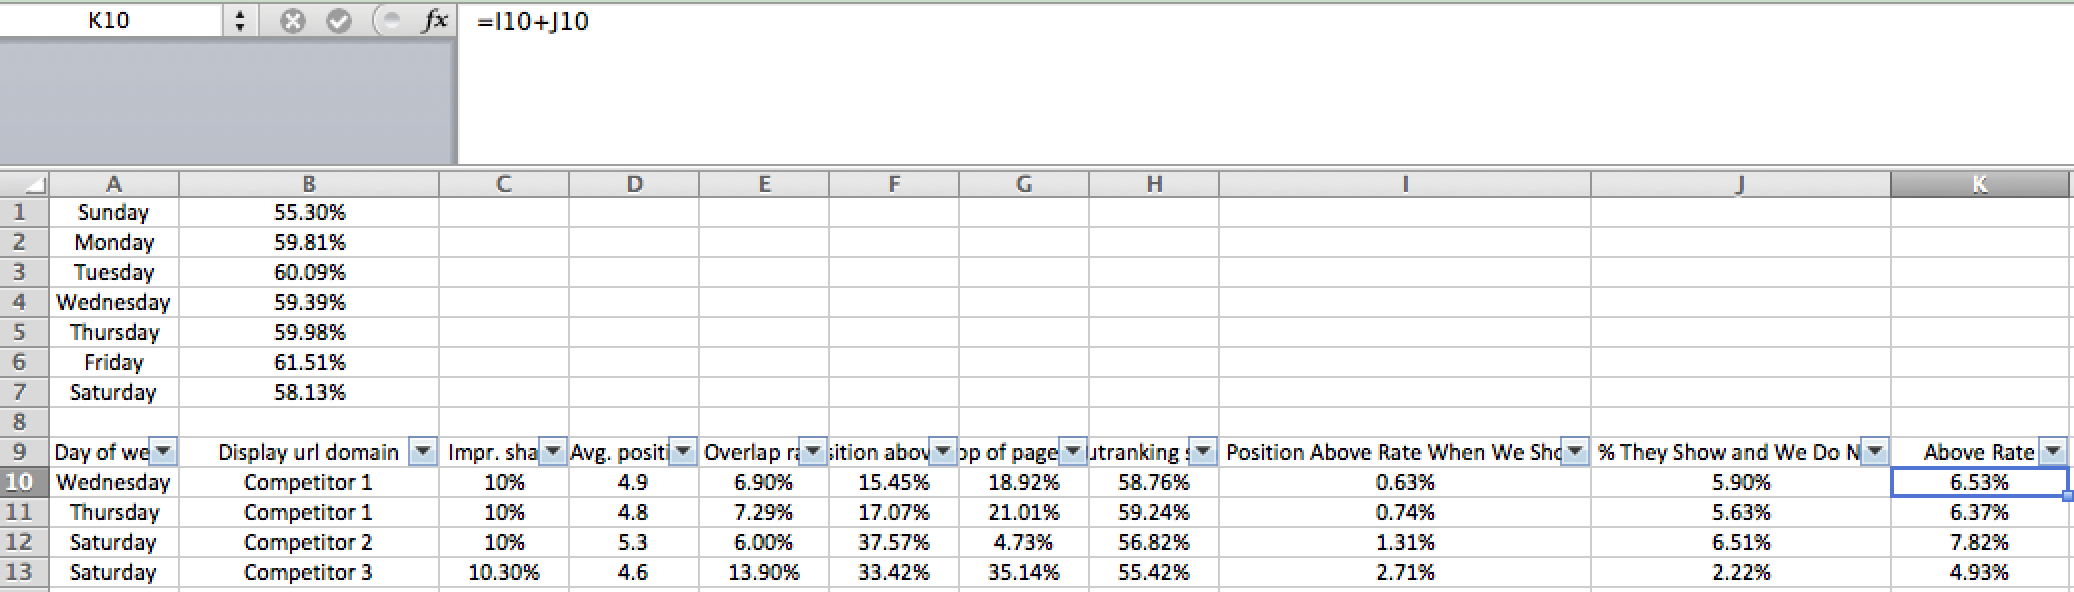
This formula will calculate how often each competitor ranks above you and pushes you down in the auction per each day of week.
Let’s put this into a presentable format through a pivot table, shall we. Ignore rows 1-8 when creating the pivot table, and only use the competitive data. From here use the format as seen below, and hide the grand total columns once the table is created.
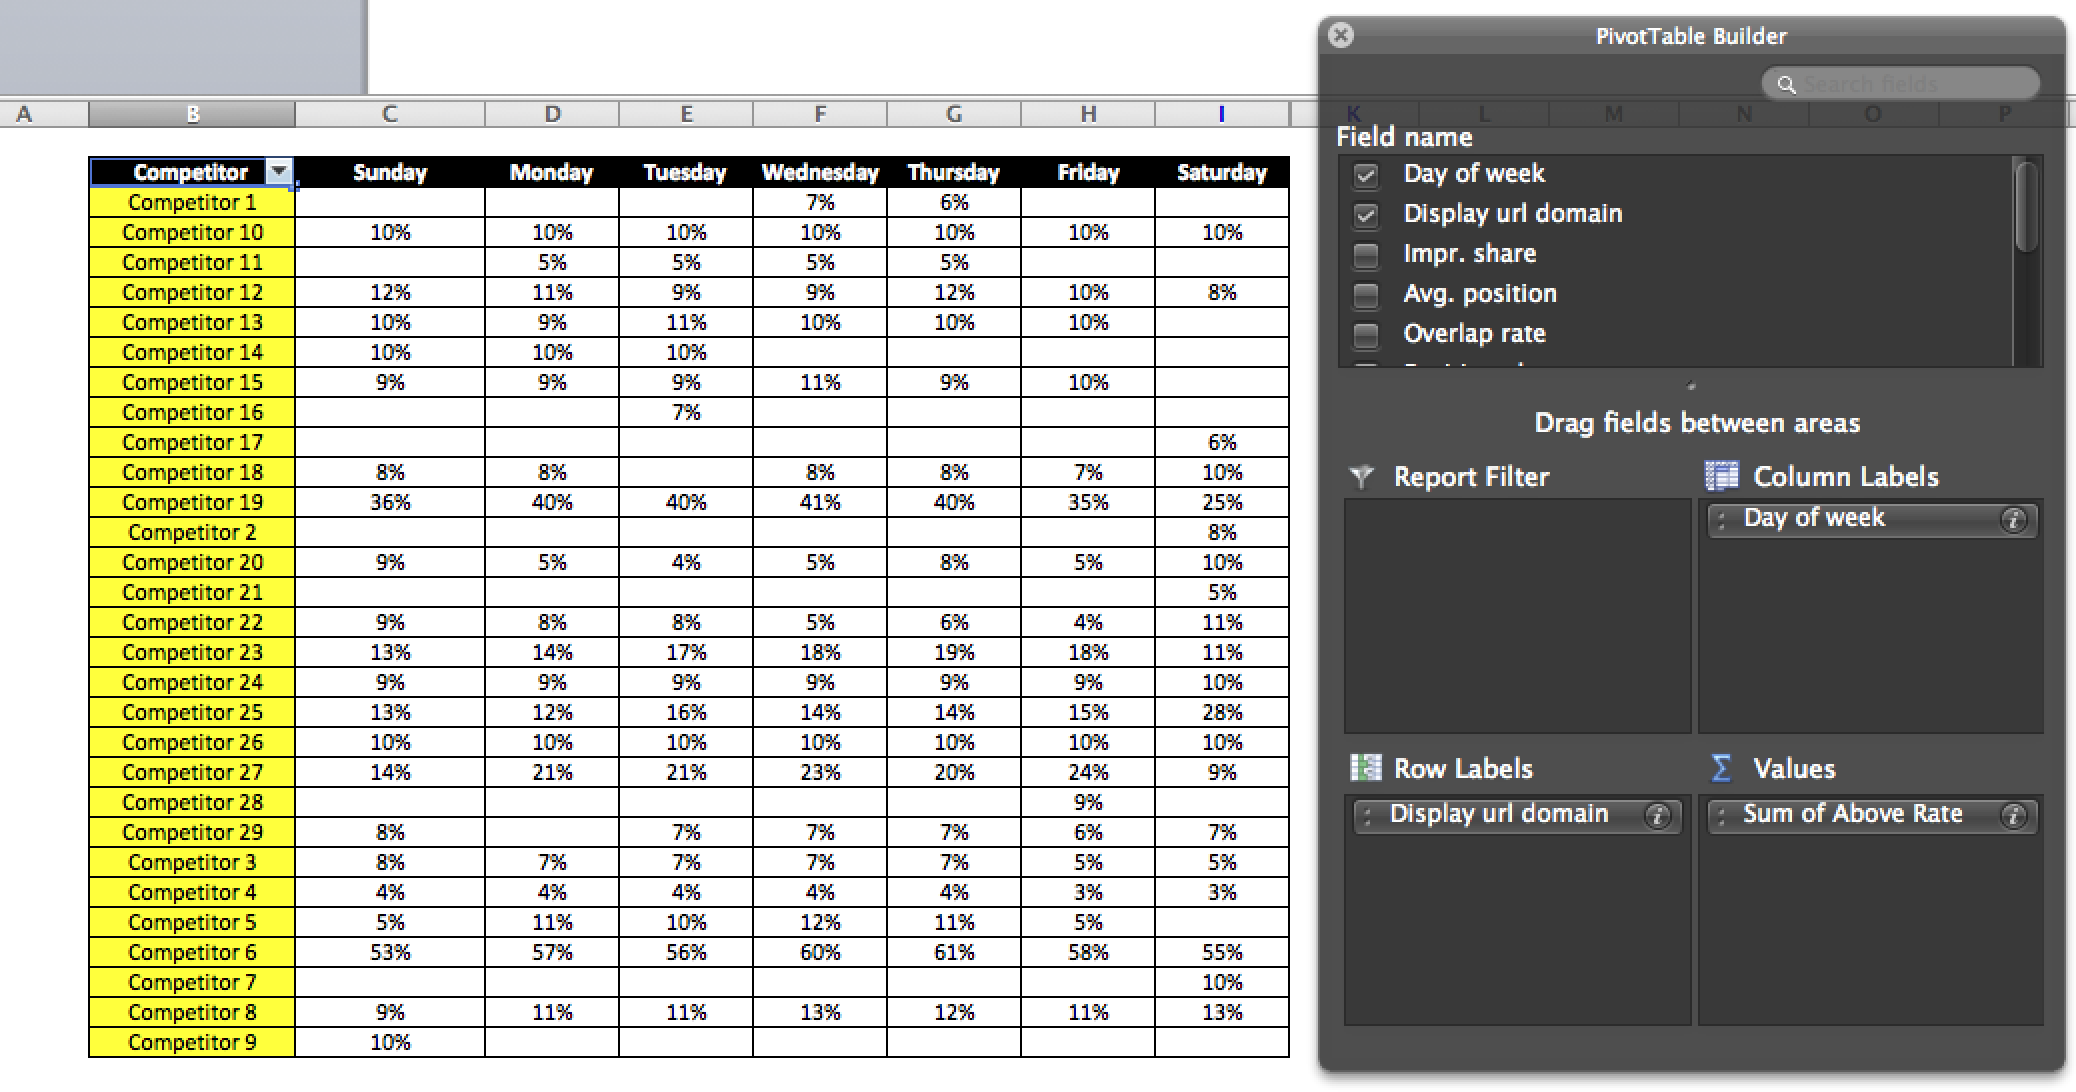
The pivot table builder shows where to put each field in order to come up with the best format for viewing how the competition is showing in auctions. This is where the data shows us how the competition is bidding differently per day of week.
Throughout the sheet call outs can be made, such as looking at Competitor 5, showing that it looks as though they turn PPC off on Saturdays. Competitor 7 looks as though they get aggressive with PPC on Saturdays and Competitor 9 on Sundays. Competitor 25 seems to get much more aggressive on Saturdays but continues to bid normally throughout the rest of the week.
In these analyses, you can also look at how differently the big competitors compare to you in terms of aggression throughout the week. Competitor 19, for example, appears to turn bids down going into the weekend on Friday, and begins to bring bids back late Sunday moving into the work week. Competitor 6 seems to be fairly similar across the board, but may lower bids slightly on the weekends as well.
This analysis helps to structure themes about the competition that you can either follow or set modifiers according to your sales volume. If you see the competition, in general, is steering bids back on Saturdays, but you have the sales volume and eligible call center on Saturdays to make it work, you can remain aggressive and take over auctions on this day for cheaper than the other days throughout the week. This analysis is useful to compare your strategies and trends with the competition to see if they align and then make decisions.
