
An Attribution Test
“Whodunit” is more than just a popular detective narrative, it is an important question in PPC as well. Attribution seeks to answer that question. So, choosing the right model for your account is important. In this blog, we’ll cover a quick overview of Google’s attribution, what led us to consider testing a different attribution, what changes you can expect, our results, and advice for future tests.
Attribution – Quick Overview
As defined by Google, “an attribution model is the rule, or set of rules, that determines how credit for sales and conversions is assigned to touchpoints in conversion paths.” When deciding which model to employ, there a several to choose from:
- Last Click
- First Click
- Linear
- Time Decay
- Data-Driven
- Position-Based
The two different attribution models that we will cover here are Last Click and Position-Based. For more information about attribution models, for both your search and social platforms, check out the article about solving attribution woes written by our very own Mary Hartman.
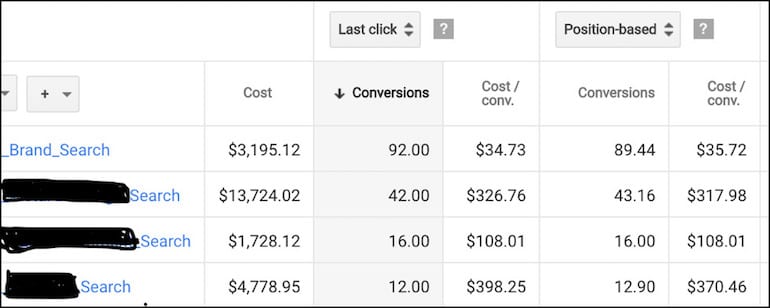
Before diving in, here are two working definitions for Last Click and Position-Based.
Last Click – This model will give all of the credit for a conversion to the ad that was last clicked and the corresponding keyword. This is the most common model.
Position-Based – This model will give 40% of the credit to both the first and last clicked ads and corresponding keyword, with the remaining 20% spread out across other clicks on the path.
Why make a switch?
I work with an Ecomm client that specializes in selling high-end products. The Last-Click model we had been using was not giving us the best picture to guide our decision making. Knowing that this product does not prompt impulse buys, we knew that we were overvaluing the last touchpoint on the customer journey. In fact, when we compare this client to a lead gen client we see that it takes the average customer about nine days before committing to a purchase compared to lead gen’s one day.
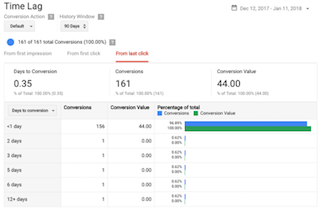
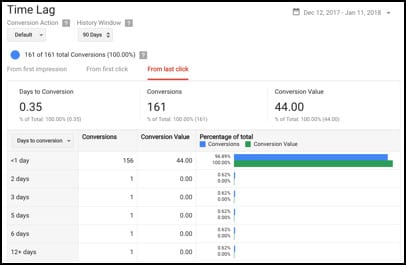
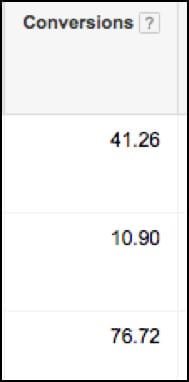
Here is an example of a lead gen client. 96.69% of conversions are completed in a day or less.
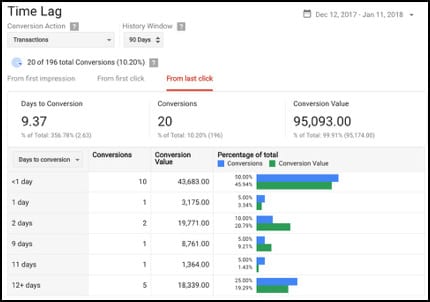
In this example, our Ecomm client selling higher-end products has 25% of their conversions and 19% of revenue come in after 12+ days.
Using the Top Conversion Path report from Analytics as a guide, we can see that a Last Click attribution model could lead to the undervaluing of Display.
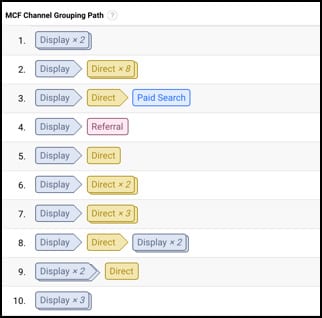
While customers may not end their journey with Display, it does play a significant role in the journey to conversion. Especially as this is often a customer’s introduction to the business. In the example above, if you receive a lead that is generated by display and closed by paid search and you are using the Last Click model, you risk undervaluing display while overvaluing paid search.
We landed on the Position-Based attribution model because this specific account was not eligible for Data-Driven. Here is more information about the data-driven attribution requirements. If Data-Driven is not an option, Position-Based attribution modeling is the next best option.
What Will Change?
After making the switch, you will begin to see partial conversions in your account.
This means that there were interactions with these campaigns that did not result in a full conversion. They were, instead, a stepping stone on the customer journey.
Another change you can expect is for Brand conversions to marginally decrease. Before making any lasting changes, you can use Google’s nifty Attribution Tool.
For this account, moving from Last Click to Position-Based would result in 2.56 fewer conversions and a $1.42 increase in Cost / Conv in the Branded campaign.
Non-Brand campaigns would result in about 3 more conversions. Again, don’t expect major shifts in data. This switch serves as a guidepost in determining which ads, keywords, ad groups, and/or campaigns are a part of the customer journey.
Results
As expected, there weren’t major data changes. In this specific example, there were two extraneous factors at play:
- Seasonality
- Budget shifts
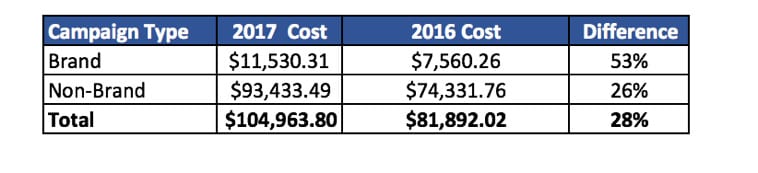
With this client, their business operates under heavy seasonality. Because of the extreme variations in MoM performance, we have found YoY data comparisons to be more helpful. Large and unforeseen budget shifts were also a factor. YoY we spent 28% more on paid search. MoM we shifted the budget down by $5,000. With spend varying so drastically, it is difficult to decipher the true impact of attribution changes.
 Even with seasonality and budget changes in mind, we did see some changes in conversion rates. Non-brand conversion rates increased by 21%. This aligns with Position-Based attribution as we would expect Non-Brand to fall in the first to mid click path range.
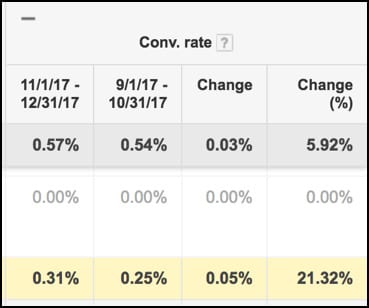
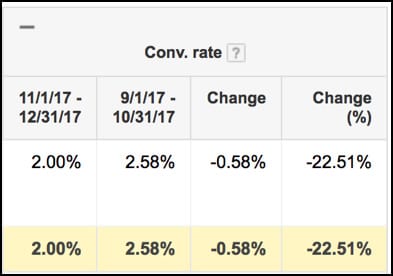
Brand, however, had a decrease in conversion rate. Again, this is to be expected as Brand will typically be the last click before conversion and as we have shifted away from the Last Click model, we expect Brand conversions and rates to reflect this change.
Conclusion & Advice
Seeing as how hindsight is 20/20, I have some advice for those of you hoping to test out a new attribution model. Firstly, begin the attribution test at the start of a month. This will give you fresh data and will allow you to compare new data to a whole, completed month. Next, if it is in your control, hold off testing this switch when going into any kind of seasonal downturn. It makes judging the overall effectiveness of the test complicated. Mitigating other major account shifts, such as large restructures or budget shifts will also help when concluding testing.
Overall, making the move to Position-Based caused us to value our Non-Branded campaigns more and to keep keywords we might have turned off with the Last Click model. With all things in PPC, happy testing friends!
—-
Article updated by Tanner Schroeder (prior post date: 1/18/18)
