
You’ve heard it before. Whether it’s a new idea you’re gearing up to pitch, or a request handed down to you from upper management. “Show me numbers!”
Thus, you have carefully examined and prepared data that show exactly what has happened in your accounts to-date, what’s worked and what hasn’t, and you are equipped to recommend next steps for future success. You know your account inside and out, but it’s not enough.
C-level executives spend 70% of their time thinking about and focused on the future. When they say, “show me numbers,” they aren’t talking about the numbers you already have. They want to know what the numbers are going to look like, based on the plan you’re presenting.

In an ideal world, historical data would perfectly predict future performance. Unfortunately, you work in the dynamic world of PPC, where that is rarely the case. New platform features, shifting competitive landscapes, changes in user behavior, and ever-rising prices bring a dose of unpredictability that cannot go unaddressed nor be reliably pinpointed.
Today, I’d like to share two methods of incorporating uncertainty into your PPC forecasts. You can use uncertainty variables to account for anticipated fluctuations in impression availability, CPCs, conversion rates, aggressiveness of competitors, and more.
Build Your Model
At the beginning of any uncertainty forecasting, you should first prepare your model using static numbers to test its functionality. Let’s assume, for this demonstration, that we’d like to forecast CPA for the coming quarter, anticipating a spike in our CPCs after the first of the year.
We’ll begin by identifying all the relevant metrics that will factor into our calculation. CPA is obviously the quotient of cost and conversion volume. Cost is dependent upon click volume and CPC, while conversion volume depends on clicks and conversion rate.
There are many more factors that can be included this model for added complexity (and additional layers of uncertainty accounted for), but because we are examining the impact of rising CPCs on our CPA, we will focus on only these metrics:
- Clicks
- CPC
- Cost
- Conversion Rate
- CPA
Building upon the relationship between these metrics, we establish the following model to calculate CPA based on given values for all other fields and verify the logic with placeholder values.
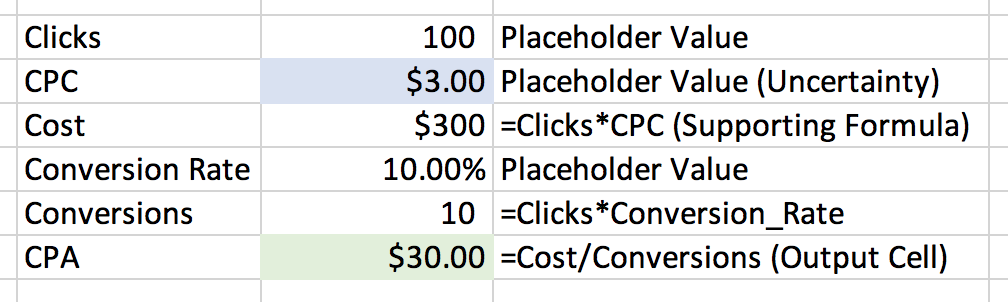
Next, we will determine the correct values for the “constants” in our model (Clicks and Conversion Rate) by examining historical data. We find by looking at QoQ data from recent years past that Q1 tends to generate 21% more clicks than Q4 of the preceding year and conversion rates tend to be 14% higher (all else constant). Combining this information with actual data from Q4 present-year, we get forecasted values for Clicks and CVR to insert into our model.
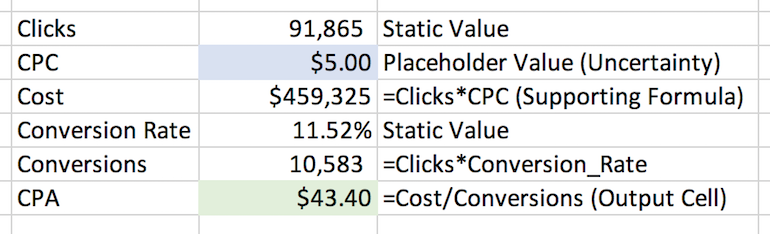
We now have two static cells, one supporting formula cell, one output cell, and one uncertainty cell. It’s time to see how changes to the uncertainty cell impact the output cell.
Uncertainty with Discrete Probability
Let’s say that, looking at historical data, we determine there is a 15% likelihood of CPCs remaining steady QoQ at $12.35, a 45% likelihood of CPCs increasing by 7% QoQ, a 30% chance of a 12% increase QoQ, and 10% chance of an increase in CPCs equal to 17%.
We take this information to create a discrete probability table and a list of “lower threshold” values that show the cumulative sum of probabilities.
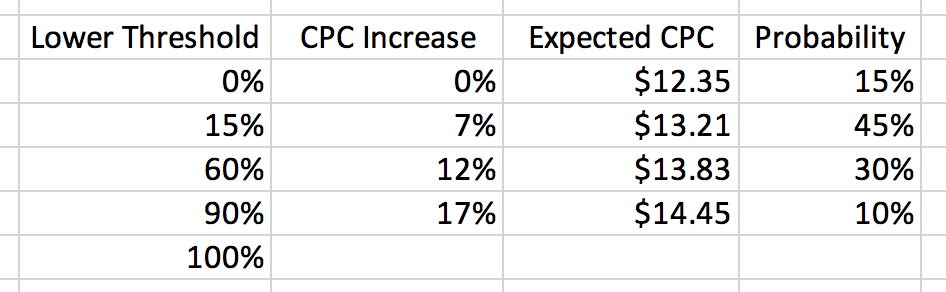
We can now update the placeholder value in our uncertainty cell (CPC) to find the Expected CPC associated with any random number between 0 and 1 according to the “lower threshold” column in our probability table.
![]()
This formula will perpetually refresh with each keystroke or press of F9 (depending on Calculation Options you have set). With each iteration of the random variable, your CPC forecast will fluctuate between the values in your discrete probability table.
Uncertainty with Normal Distribution
Now, assume that we are not able to establish a discrete probability table, but rather want to assume that possible CPC values are normally distributed with a defined mean and standard deviation (Mean and standard deviation can be found by looking at CPCs on a daily, weekly, or monthly basis for some amount of time and using the =AVERAGE() and =STDEV() functions in Excel).
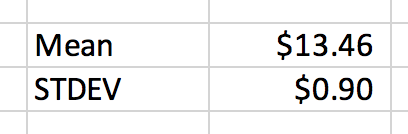
In this instance, we find a mean of $13.46 and standard deviation of $.90. To find out expected CPC, we need merely use the =NORMINV function in excel, replacing the desired probability value with a random variable.
![]()
This formula will generate a random number between 0 and 1, and identify what value corresponds to that probability on a normal curve with the designated mean and standard deviation.
Iterate and Evaluate
Now that we have our uncertainty variable in place (whichever method you opted to use), it’s time to track multiple iterations of the possible outcome and evaluate with statistics. The quickest and easiest way to do this is with a data table.
First, we will create a numbered row for each desired iteration (e.g. 1000 rows for 1000 iterations—Fill Series is a great feature to help with this). In the cell directly above and to the right of “1”, we will reference our output cell (in this case, CPA).
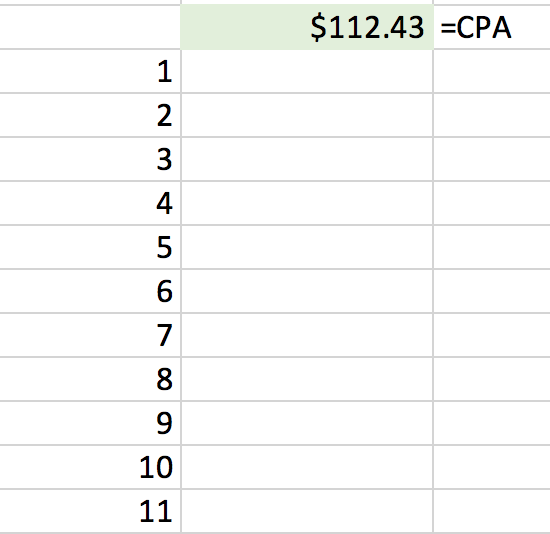
We then use the What-If Analysis feature to create a single-variable data table, leaving the row input cell blank and selecting ANY EMPTY CELL for the column input cell.
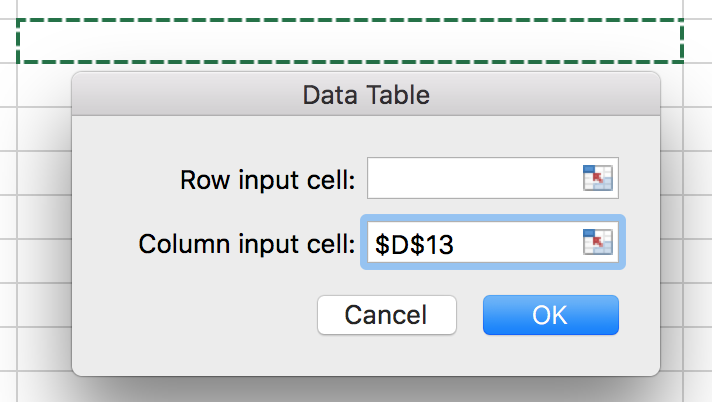
This will iterate the random variable the specified number of times, providing a pool of possible output values according to the probability criteria you established. Taking the mean, standard deviation, min and max values of the output values in this table will give you an approximation (and understanding of likely fluctuation) of actual CPAs for the upcoming quarter given anticipated but uncertain increases in CPC.
Closing Thoughts
The method outlined above, though a simplistic example in many ways, provides a foundation for incorporating uncertainty into your forecasting models. While the world of PPC is enthusiastically data-driven, we also know that it is oftentimes unpredictable. Learning how to account for unexpected shifts will strengthen our forecasts and make it easier to move forward with confidence in our digital strategies.
It is true, there may never be a true “crystal ball” for anticipating future account performance, but a well-constructed model and a handful of uncertainty variables can certainly help us get close.
