Time Saving Automation: Search Query Edition

Search Query Reports (SQRs) – you either love them or hate them. Nonetheless, they are an extremely important component of a PPC campaign. While you probably pull these semi-regularly (or maybe you don’t do them at all), are you getting the most out of them? With a little bit of work on the front end, you can save time by automating these reports. Once you get it all set up, simply check in on the Google Sheets workbook every month (or whatever schedule you like to run your SQRs on).
We’ve already covered SQRs here and here, but today we’ll cover alternative methods to automate your search query reports.
Automation Set Up
The Script
Setting up this script allows us to segment search queries into “N-Grams”, which is a fancy way of saying “common phrases.” Once you get it up and running with a few tweaks to the code, you’ll get two sheets for each N-Gram, an account-level report and a campaign level report.

N-Gram refers to the number of words in the phrase. You’ll also get a word count analysis sheet which shows you performance by query length.
Supermetrics
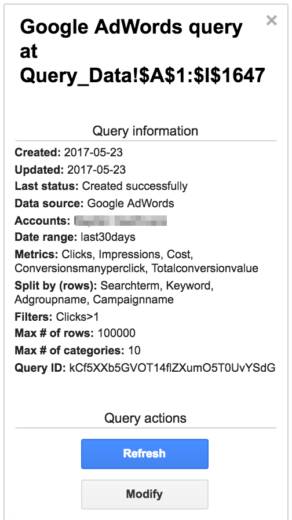
From Supermetrics, we want to pull in an aggregate view of the queries, along with a more detailed report that also pulls in campaign and ad group.
*Note: If you don’t have a paid version of Supermetrics, you can either paste the data in manually or use the free version to pull SQR data from Google Analytics.


Setting Up The Report
From the Supermetrics report, we’ll use query functions to pull the following:
- Non-converting queries
- High CPA queries
- Cross pollution
For each of the above reports, we pull an overview using an aggregate view of the queries, along with a more detailed report that pulls in keyword, campaign, and ad group data.
Using query functions (appropriately named in this situation!), this is pretty easy. Just one formula to create each table.

In this instance, column E is the conversions column.

These queries can be easily modified to fit your needs. You also have the option to add additional sheets to the report to look at whatever else piques your interest (example: converting queries where the query =/= the keyword exactly).
Cross Pollution
For cross pollution, we’ll start with a simple query to count up the number of keywords, and sum the associated clicks, cost, conversions, etc. Then we’ll use an IF statement to determine whether or not it qualifies for cross pollution.

Now, we’ll use the =countunique function along with the FILTER function to count the number of unique campaigns matching with each query.

Next, we go back to the Query_Data sheet that contains our Supermetrics pulled data and add a few helper columns.

A quick VLOOKUP allows us to pull in whether there is cross pollution for that term and the count of campaigns.
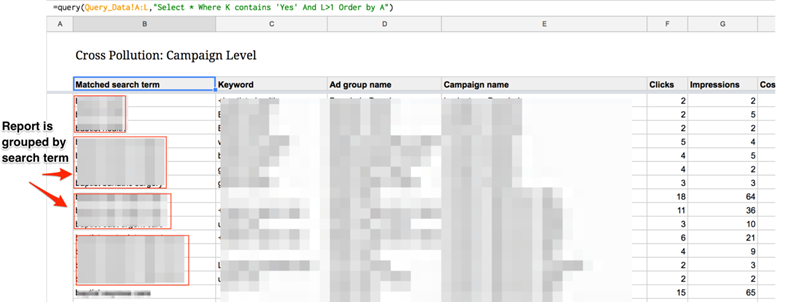
From here, we use another query formula to filter the Query_Data sheet for terms that are cross polluting in the account, and are matching to more than 1 unique campaign. By ordering by the search term, it lines things up nicely.

A Note on Cross Pollution
In some accounts, it would seem that there is a lot of cross pollution happening due to the campaign structure. For example, if you have multiple campaigns that are identical apart from their geo-targeting, this report will say that you have an alarming amount of cross pollution.
Finding Takeaways
So now you’ve got the bones of the report set up, how do we now find learnings and/or action items?
For The Supermetrics Reports
From the high CPA and non-converting terms reports, this is pretty simple. Just look for any queries that are underperforming or anything that’s really irrelevant. When you do find terms to pause or add to the account, use the campaign level report to see exactly where to pause it.
From the cross pollution reports, look at which campaigns and keywords are capturing the same queries. How does performance differ? Use this information to better funnel your traffic, whether it’s with negative keywords, match type adjustments, etc.
For The Script Reports
For each of the N-Gram reports, look for any common themes and high performing phrases. For the top performing phrases, consider taking a look at your SQR report and filtering for anything that contains the phrase to get a better idea of what kinds of queries these phrases are occurring in.
The word count report can offer some interesting insight into CTR and conversion rates for longer tail queries vs. one or two-word searches. Keep this in mind when adding new keywords to the account, and think about the conversion funnel.
Closing Thoughts
While SQRs (probably) won’t be the thing that makes or breaks your account, it is a simple task that can have an impact on your account’s efficiency and performance. Many will skip this report, or do it very rarely, because of the time it takes to download the data and sift through it via zillions (okay, maybe an exaggeration…) of pivot tables.
Taking some time to set up an automated report cuts down on a lot of friction and makes it a lot easier to pull out insights. As a bonus, if you’re managing multiple accounts, use this same template for both. Simply copy the Google Sheets file and switch out the accounts. Easy! Now go forth and mine those queries!


