
Enhanced campaigns are as bad as we feared. Hanapin has migrated many of the accounts under their management and have found that performance is typically slipping; and sometimes it is even cliff diving.
This post analyzes ~$1 million dollars of that ad spend pre and post enhanced campaigns (ECs) and uncovers where performance has dipped, how spend allocation has changed (due to less control) and a few takeaways we’ve learned for how to stay ahead of the competition on this.
A quick note about this data is that while CPA is up across the board this is partly due to seasonality for a few major accounts. It’s obvious though, that CPA is up on computers for Search and Display but that mobile and tablet CPA is up at a much, much larger percentages and has started to make up larger percentages of budget allocation. This is also macro data so one account with high CPA goals that has increased budget over the past few months could drastically skew these numbers.
The cliff notes are that since launching enhanced campaigns:
- Mobile CPA is up 40% (this is with negative 20-50% bid multipliers in most campaigns)
- Mobile spend is up 80%
- Tablet CPA is up 13%
- Tablet impressions, clicks and cost are up drastically
- Total CPA is up 17%
- Total conversions are down 7%
Some accounts, I will say, have seen increases in CPA but they were so far below goal that the extra sales were worth it even at the extra cost. All in all though, ECs have been detrimental to most accounts. In many accounts we have had to opt out of mobile completely (bid -100%) and are seeing inflated CPA due to a sudden increase in Tablet traffic.
Now, here’s the data for all those super-PPC nerds who want to know what they are in for. This first section is looking at ~$1 million dollars in ad spend across ~50 accounts pre enhanced compared to post enhanced WITHOUT segmenting by network (Search Vs. Display):
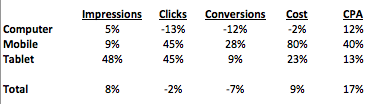
Change in Primary PPC Metrics

The above table shows the change in primary metrics by device for before and after migration. In other words, impressions on computers has increased 5% since the migration, clicks are down 13%, conversions are down 12% and CPA is up 12%.
These numbers all lead to more budget being soaked up by mobile and tablet devices and thus while there are still impressions out there to be had for desktop, I am not able to allocate my budget to that better performing device. For example, computer clicks are down 13% but mobile and tablet clicks are both up 45% (and mobile CPC is up 24%)!!! With CPAs that have increased by 40% and 13% respectively! Yes, a 40% increase in mobile CPA and that is with mobile bid multipliers that average greater than -30%.
Change in Allocation of Spend/Clicks/Conversion After Enhanced Campaigns
This shows the changes in percentage of spend coming from mobile devices and tablet devices since the migration. The reason this is being pointed out is that you can no longer control budget allocation by device (which you used to be able to do by targeting devices in different campaigns and using campaign daily budget to control spend).
Mobile Devices
If we look at the percentage of impressions, clicks, conversions and cost coming from mobile devices (compared to desktop and tablet) we see the following results:
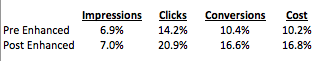
So this means that mobile has gone from making up 10.2% of total spend to 16.8%. And remember, CPA has gone up 40% to go with that extra spend. Sweet.
Tablets
For mobile, we can at least adjust the bid multipliers to virtually opt out of it. No such luck with tablets. Let’s take a look at what’s been happening there:
![]()
Much less alarming numbers here. Cost is up from 10.2% of total spend to 11.6% and as the very top chart showed, CPA is up 13% which is pretty close to an increase in computer CPA we’ve seen. The only real issue is that tablet CPA is 42.5% higher than computer CPA to start with. So while it hasn’t performed much worse since the migration, it is performing much worse in general and now we have no shot and stopping the damage it is doing.
Enhanced Campaigns by Search and Display Networks
The bulk of performance change came from display. Interestingly enough, impressions are up significantly but clicks are down. Spend is up in both networks and CPA is up a staggering 38% in Display.
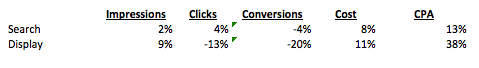
More specifically, Display CPA is up 67% for mobile devices! Search CPA on mobile devices is up 40%. Computer Display and Search CPA is up 28% and 8% respectively. So you can see that while CPA is up across the board, it is certainly up even more drastically for mobile devices. Lastly, tablet CPA on search remained stable but is up 60% on Display.
A Handful of Enhanced Campaigns Takeaways
It’s a bit ugly in the ECs space right now. Optimizations are difficult (you can’t pull conversion data and spend data in the same place as bid multipliers so you have to merge spreadsheets to actual measure impact of bid multipliers and make optimizations based on it), you are best off bidding -100% on mobile until you can slowly turn it up and get it running at acceptable CPA’s, Display is the hardest to optimize with the changes and the impact is very clear.
We have also found that the lower you bid on mobile the worse mobile performs. Meaning you are better opting out then going in at -50% because you only get bottom of the barrel clicks at a mobile bid that is -50% of your desktop bid.
The better structured your accounts the better results are. Those accounts that are very segmented so making ad group level bid modifiers affects fewer keywords and those keywords are more tightly related perform better from enhanced campaigns.
So what have you guys seen? Or is everyone else still holding off until the night before the migration, I mean “upgrade”, deadline?
