Win the Mobile Bid Battle with 3 Easy Excel Reports

Of all the issues we deal with in PPC, the question of what to do with mobile traffic seems to come up more often than the rest. In many ways, it’s the next big problem we have to face (alongside attribution in general)- is there any value to this traffic? If so, how do we properly account for its value? And what role does it play in our marketing efforts as a whole?
While those questions are a bit beyond the scope of an 800-word blog post, it’s still helpful to talk about optimization strategies you can employ to get more for your money when it comes to mobile visitors. Not just in terms of direct returns, but in how it contributes to all your other campaigns & channels as well.
Note: If you’re looking at your Mobile traffic and adjusting your bid modifiers purely from an ROAS or CPA standpoint, there’s nothing wrong with that! It’s a totally valid strategy, and one I employ often. It just might help to expand the scope of metrics that you look at.
So to help, here are three easy reports you can pull that will help you win the mobile bid battle:
Analyze Your Mobile Average Position
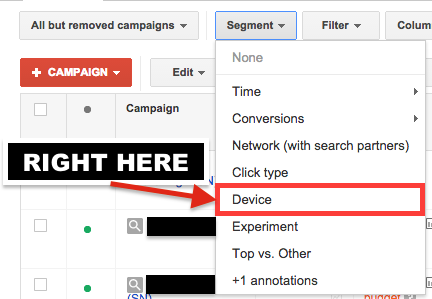
To pull these reports, you’ll be making heavy use of the “Segment” button- splitting out your data by Device in this case.
It’s right here.

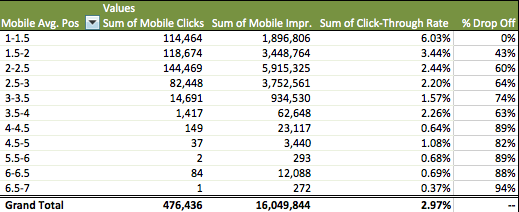
With that data in-hand, you can analyze your Mobile Average Position at either the Campaign or Ad Group level. But why Average Position, you ask? Because Mobile Click-Through Rate drops off much faster than Desktop Click-Through Rate the lower your position.
See for yourself:

In the above example, our mobile CTR drops by over 60% just from hitting positions 2-2.5, and continues along that path until we’re functionally invisible at positions 3 and on. It’s a much more pronounced drop-off than we see in this account’s desktop traffic.
Why is that? Well, on desktops, we’re afforded the luxury of two to three spots in the top-of-page position. For mobile, though? Subtract one. Subtract two (or three!) if there are Shopping ads to compete against. You’ll also lose out on your Sitelinks if you get pushed out of the top positions! For instance:


In some cases, Shopping ads will push PPC ads on mobile down below the fold entirely. Check for yourselves: Google (or Bing) my go-to demonstrative search term “red shoes”- last I saw, Shopping Ads stole the show there with nary an ad to be found until you reach the bottom of the page. There’s probably another discussion to be had about the importance of Shopping ads for your mobile advertising efforts, but just know that it takes priority over regular ads right now.
Armed with this knowledge and your device data, it’s a simple matter of implementing some Excel filters to identify ad groups that meet the following criteria:
- Campaigns and/or Ad Groups that have a mobile average position greater or equal to 2.
- Campaigns and/or Ad Groups that have a Cost Per Conversion or ROAS at or better than your designated account goal.
This is the lowest of the low-hanging fruit. These are places where you’re already at goal, and you can substantially increase your traffic with just one minor bid modifier. That being said, there are a few other metrics you can look at beyond just average position.
Analyze Your Lost Mobile Impression Share
For this second segment, you can pull it in the exact same report that you pulled your Average Position- just include the columns that examine your Lost Impression Share due to Rank and/or Budget. Budget is slightly less useful, as there’s no way to control spend distribution by device (thanks, Enhanced Campaigns), but it can give you an idea of where your money will be going should you decide to increase your budgets.
Lost Impression Share due to Rank, though, can help you find opportunities that go beyond an arbitrary Position cutoff. It can help you identify ad groups where anything less than position 1 means you’re missing out, or it can help you identify ad groups where an increase in your bid might not do anything except increase your average CPC. Using your handy Excel filters, filter for the following:
- Exclude Campaigns and/or Ad Groups that meet the criteria from the previous report. No need to accidentally double-up on bid modifiers, right?
- Look for Campaigns and/or Ad Groups that are losing out on a significant number of Impressions due to rank- meaning a low bid. Try a Lost Impression Share due to rank greater than 10% to start, or 25% depending on how comfortable you are with Lost Impression Share due to Rank as a metric.
- Campaigns and/or Ad Groups that have a Cost Per Conversion or ROAS at or better than your designated account goal.
In this case, you’re filtering for places that are profitable and could stand a bid bump, regardless of the average position. Basically, catching where a position better than 2 isn’t quite enough.
And finally…
Analyze Your Estimated Cross-Device Conversions
This report is entirely contingent on how much faith you place in Google’s estimations. It’s not 100% accurate, but it *is* a good way to start taking a holistic view of your advertising campaigns. Your mobile advertising plays a role in the overall conversion process, even if we can’t directly tie it to in-store or cross-device sales yet.
Anyways- this is done in a similar fashion to the above two reports:
- Filter, delete, or exclude all that same data from the above two reports. No need to double (or triple, in this case) up on bid modifiers.
- Regardless of position, regardless of ROAS, and regardless of CPA, examine which campaigns or ad groups are contributing cross-device conversions.
I wouldn’t necessarily use this as a metric to recommend major positive bid modifiers- but it might help guide your hand a bit with tricky negative modifiers. It’s definitely third on the priority list, as you should focus on the Average Position analysis first, followed by Impression Share- but it’s an important piece of the overall picture. If we can ever move from estimated cross-device conversions to actual cross-device conversions, well, then we’ll be cooking with gas.
What about you, PPC Heroes and Heroines? Have any mobile reports you like to pull to stay ahead of the competition? How much faith do you place in the estimated cross-device conversion? Let us know in the comments and, as always, thanks for reading!


