
If you are involved with PPC, I guarantee you have created a report at some point. If you haven’t, you have probably been given a report to read or analyze. After all, we let the numbers speak and dictate the direction of account optimizations. You may even be able to create a report in your sleep. That being said, what’s worse than knowing what you want to report on and having no idea how to get there?
Look no further. Here are three tips to save you reporting time in Bing Ads and get you the data you are looking for.
What To Report On
No, I’m not asking. There is a setting that allows you to tell Bing what you want, rather than Bing telling you what you are going to get.
When dealing with multiple accounts for the same brand, it becomes a tedious task of moving from one account to another and compiling data in order to compare metrics across the brands. This is where the “What to report on” setting comes in handy.
While in Bing, simply go to the reports tab and select the type of report you want. From there, determine if you want to segment by a specific unit of time, the date range you want to look at and the format. Finally, choose what you want to report. By default, the current account you are in will be selected, however, you have the ability to choose multiple accounts in order to generate a report that contains an aggregate report containing data for all accounts or brands.
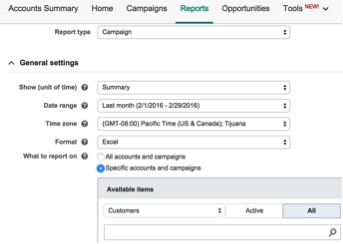
One item to keep in mind is that the accounts do have to be in the same client center. As long as they are, you can download your report and analyze the data or utilize a pivot table to view the data in various ways.
Filter, Filter, Filter
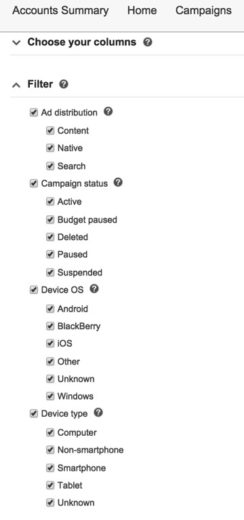
When combined, data can be deceiving. It tells the end of the story, but can easily miss what happened during the journey. The more granular you view the data, the more opportunity you have to catch inefficiencies within your account. This granularity can be easily achieved by selecting a filter, which categorizes your data and allows you to see performance segmented by filter. Here you have four options and you can filter by all of them. This report setting can be found right before the report is run.
Where Did That Report Go?
So you have manipulated the report settings, ran the report and made a fancy table in excel. The next week rolls around and you select every setting again, just like the week before and create the exact same report. This process goes on for weeks. Why not save a little time and have the report run at the simple click of a button? Even better, why not have the report waiting in your inbox?
This ever so simple step is often forgotten and underutilized. Before hitting run the next time, stop and think, “Is this report something I am going to run again and again?” If you answered yes, stop and do the following.
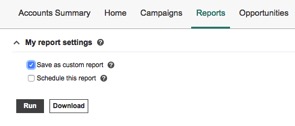
Save the report as a custom report. This setting can be found right before you run the report (see image below). The next time you go into reports, on the left-hand side under “Custom Reports” your report will be waiting for you.
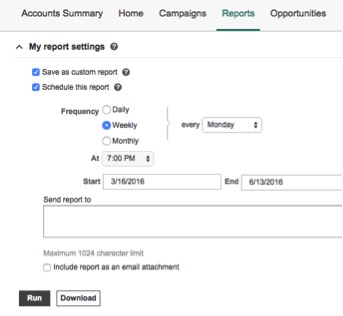
Schedule the report to run and be sent via email. Again, this setting can be found right before you run the report (see image below). You can then select the frequency of the report, when you want it to run and a specific duration. From there, you can have the report sent to your email.
Closing Thoughts
In the world of PPC, time is of the essence. Most of the time, you are accountable for dictating your own schedule and deciding where and what you are going to spend your time on. Make the most of it by taking a few seconds to save you time over the long run. Create the report you need one time, save it and set it to run every day or week.
