
One of our favourite talking points in the PPC industry when it comes to testing is deciding when we have enough data to judge our results accurately. On the face of it, this should be a fairly straightforward process, albeit with a little bit of maths involved, however it rarely seems to be as simple as it seems.
For the past couple of weeks I’ve been working heavily on both ad and landing page conversion rate testing and wanted to dive into some of the things I’ve seen and a few of the pitfalls to avoid with your testing.
Let’s get started by looking at an overly simplistic example:
Ad 1: 1 click, 1 impression, 100% CTR
Ad 2: 0 clicks, 1 impression, 0% CTR
By the numbers Ad 1 has this test in the bag – 100% vs 0% CTR. However, neither you nor I are foolish enough to assume that this proves ‘ad 1’ is doing better. That is because we know that we don’t have a statistically significant amount of data yet. Most of us in PPC are well aware of this fact, but what we aren’t always so great at is knowing at what point we can conclude an ad test.
Before we go any further I also want to point to this article which discusses how statistical validity can lead you astray (probably a good pre-cursor read before accepting everything I say as gospel).
Too soon?
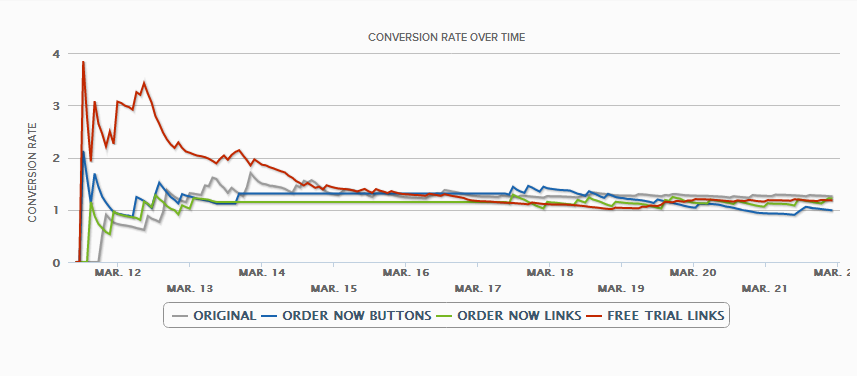
The crux of this blog post is to convince you not to end your testing too soon. I want to highlight a graph from some recent CRO (landing page) testing I’ve been conducting.

In this experiment I have 4 variations of landing pages:
- The original
- One with extra ‘Order Now’ buttons
- One with the same ‘Order Now’ messaging but as text links rather than image buttons
- One with ‘Free Trial’ text links
If you can make out the graph, you can see that for the first few days the ‘Free Trial’ variation blew the competition away -> it looked like a conclusive win for one of my new pages with future untold benefits to our PPC campaigns to be reaped. Unfortunately after a couple more days I came crashing down from my exuberant position in the clouds – this was a statistical anomaly and in actual fact, none of my new tests were better than the once languishing original.
After seeing this I thought I’d better re-investigate some of my recent Ad Copy testing to make sure I wasn’t guilty of making changes with the same kind of false hubris I experienced with my CRO testing.
If you’d like to learn more about the maths behind A/B testing, Visual Website Optimizer wrote a good piece about it on their blog. Essentially what you want to be able to say is that you are more than 90% confident that your test ad either won or lost an experiment. There are a ton of great resources online – I like to use one of these normally:
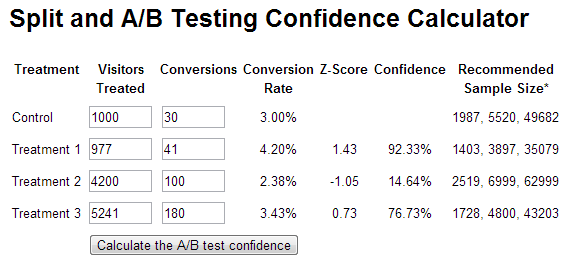
What I like about the one pictured above is that I can easily see across multiple sets of ad copy the level of confidence that it will beat my control copy. In this case I can almost certainly pause Treatment 2, and could declare Treatment 1 a winner if I’m happy to accept 90% statistical significance. However, despite these handy tools there are a couple of things to watch out for…
Which metric are you looking at?
One major problem with testing is deciding what your key metric is. In most cases you are going to go with conversion rate or click-through rate. These are the two options that Google allows you to automatically adjust for in your ad targeting settings too. My preference is looking at Impressions Until Conversion as it takes both of these into account.
AB Testing or letting Google?
When Google tried to force us to abandon the ‘Rotate Evenly’ setting for our ads it elicited outrage in the community. The reason being that a lot of people 1) don’t really trust that Google gives enough time to each ad when optimizing, and 2) everyone has different standards for judging their tests to be completed. If you aren’t really a maths whiz, you might be best off letting Google do the heavy lifting (find ad rotation options in your campaign settings tab), but I’d recommend you have a go at doing it yourself first.
Looking over the right amount of data?
One of the big problems I always have with Google’s auto-optimizing is that I don’t trust it has enough data (it starts to optimize towards ads with 1 conversion vs 0 over 10 clicks it feels like). The calculators I linked to above will tell you how large of a sample size you need to conclude your experiment. Make sure that you don’t conclude even a statistically significant test with too small of a sample – much link the linked CRO test above – this can be dangerous.
Going by ad group or bringing data together? Which is better anyway?
If you like pivot tables in Excel, you have the option to conclude your ad tests by pooling a lot of data over multiple ad groups and campaigns. Instead of judging each test on an ad group level you can pivot all that data (those data?) and say that across your entire account ad copy B was better than ad copy A or C. See this post from Eric for more information on how to do this.
Pros of aggregating your testing: Way more data (easier to get statistical significance), reduces chances of outlier keywords effecting your overall plan for account ad copy, makes it easier to keep your ads nicely ordered within your account (Just 1 or 2 winning sets running).
Cons: Your ad groups are carefully segmented – so it stands to reason that your ad messaging will perform differently in each ad group. Pooling the data only serves to reduce down the granular testing you were running.
The best approach to have when it comes to this testing is:
- Get enough data
- Don’t rush to judge your experiments a success
- Record/aggregate your results in a sensible way
As always, if you have any questions related to testing within PPC, or any tips to share with the community, feel free to share them in the comments below!
