
When I first started working in PPC, I loved building reports – I was new, I had the time, I loved getting into the weeds of all the data for that month. As my career progresses, I’m finding less and less time to sift through data to create my own reports manually.
Here’s the bright side!
Since I am a data nerd and love learning new things, I invested in myself and have the goal of being a superstar at Google Analytics. I can still get into the data, and have more time to analyze trends, all with the help of a nifty feature in Google Analytics – Custom Reports!
I absolutely love Google Analytics and don’t know how anyone can live without it – you can see data in so many different levels, with many dimensions to choose from, without having to download multiple data sets and tackle the challenge of making it all fit together. You’re able to take so much more data and have actionable insights right at your fingertips, all within the interface. Google Analytics allows you to be creative with how you’re viewing performance and makes it nice and tidy to perfectly fit in a PDF report if you need to send it off.
Definitions Of Custom Report Features
In order to use custom reports, you need to know what each term means to build out a sweet, showstopping report. Every report that you create in Google Analytics will have a dimension and a metric, sometimes even two dimensions! If you’re already super confused on how to analyze data without custom reports, check out this post on Key Google Analytics Features for Effectively Analyzing Data first before diving into custom reports.
But if you’re rocking it already and ready to step up your Analytics game, let’s get into what those mean, as it’s important to know the difference between a metric and a dimension.
Dimensions
These are attributes of your data, so when reporting on Google Ads, that can be Campaign Name, Keyword Text, et cetera. But you can also be a niche as City, Device, Source/Medium of where your traffic came from – the possibilities are endless!
Metrics
These are the quantitative metrics assigned to your dimensions. In Google Analytics, Pages/Session, Transactions, and Users are all examples of metrics.
Secondary Dimensions
This is where the fun begins! Google Analytics allows you to select a primary dimension, and then layer on another dimension to view data in the same table.
Segments
This is a subset of your Analytics data. These allow you to isolate and analyze data based on specific criteria that you choose. For example, I like to use Device segments to see where my Google Ads purchases are coming from, see where my traffic is coming from, and create a strategy to optimize performance on underperforming landing pages.
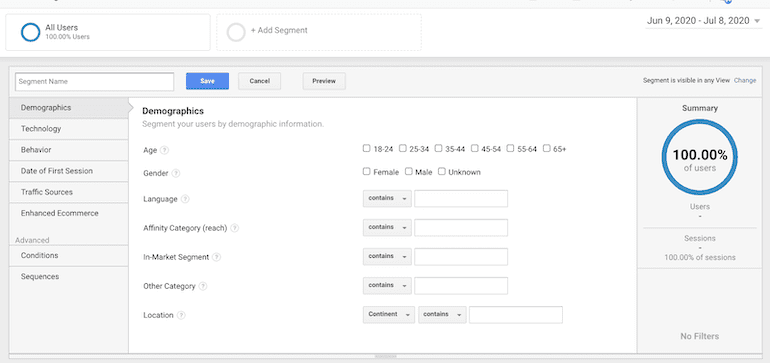
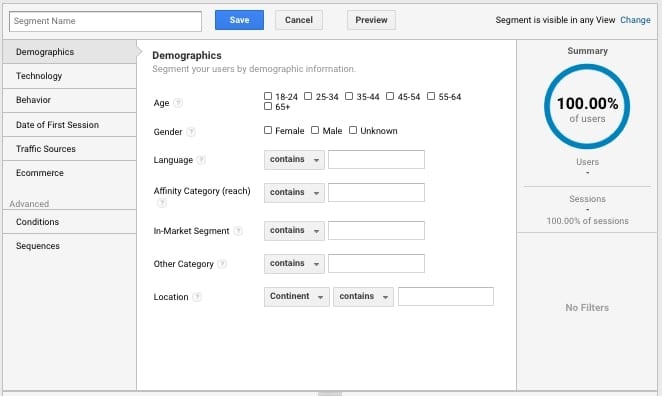
How to Build a Segment
I constantly use segments to analyze and categorize user behavior on eCommerce websites. It’s the easiest way to see how your webpages are performing on different devices, or user behavior on your website, or even which age group is buying the most of a product. Again…the possibilities are endless, and building a segment is super easy!
First, you want to go to the top of your data interface and select “Add Segment”.

Next, you’ll select New Segment.

Then get creative! What trends have you been seeing in your account you would like to dig deeper into? Are there certain age ranges you’re trying to reach? Are there locations that traffic may have dropped off at, and you want to look into increased competition in the area? The world is your oyster!
Building Custom Reports
From here, you’re able to start building out your custom reports to not only analyze your questions and dig deep into the data, but present them in an organized and concise manner. I like to tentatively build out what my report would look like in the interface first so that way I know exactly what I want to build in the custom report first.
Steps to create a custom report are:
- Open Customization tab and select “Custom Reports”
- Select “New Custom Report”
- Fill out the general information that you’ll need to start with. This includes
- Title
- Report Tab (each report has at least one tab, but you can add more than one if that serves your purpose better)
- Report Type. I typically use Explorer reports. Check out Google Analytics’s different Custom Report Types and see which would fit your needs.
- Select Dimensions and metrics you would like to primarily use.
- Save
And there you have it! Then, you can use your segments to further narrow down and analyze your data. There’s no wrong answer in Analytics. If you can think of it, you can build it! Get creative. It may take more dimensions and segments, trial and error, but the best way to learn Analytics is to get your hands into it. Happy reporting!
