
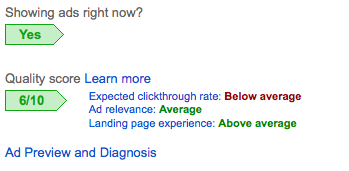
AdWords Quality Score is an important component of your ad rank. Your overall score has always been simple to pull but checking the individual factors was painful. You could only access these factors through tool tips making it impractical to view at a scale.
AdWords recently added the three major factors to the API reports, meaning you can access these ratings as you would any other keyword report. No need to go keyword by keyword in the interface.
We’ll start with a quick recap of quality score and then jump into how to pull the data via a script.
Why Does Quality Score Matter?
Quality Score is used as a signal for the relevance of your keywords, ads, and landing pages to user search queries, making it a useful diagnostic for your AdWords account. It gives insight into what parts of your account are considered relevant and which need extra work.
Since higher scores indicate higher relevance they are favored with potentially lower CPCs. The simple ad rank formula is Quality Score x CPC. If Quality Score goes up, AdWords estimates that your ads are more relevant and you can achieve high ad ranks, at the same or lower CPCs.
This explanation isn’t to say Quality Score is the most important metric but it is a helpful diagnostic. You should always optimize based on actual performance but Quality Score can give you additional direction.
Quality Score Factors
Quality Score is made up of three major factors. These are:
- Expected CTR
- Landing page experience
- Ad relevance
Expected CTR indicates how likely a user is to click on the ad compared to other advertisers. Note that expected CTR is adjusted for position. So a simple increase in CTR by ads potentially being higher on the page will not necessarily improve this rating.
Landing page experience indicates how aligned the expected landing page is with the query. Does the page relate to the query? If a user is searching for a product, is that person directed to a product page, or in a worst case scenario, the about me page?
Ad relevance rates the query against the content of the ad. If a user is searching for car tires, an ad that mentions car tires is much more relevant than another ad for car parts and services.
AdWords takes these ratings and assigns a score from one to ten. One being the worst, with few ads showing, to a 10, which is the top score of all three factors.
Accessing The Factor Data
At this point in the post, you may already know all of this information. If I told you to keep an eye on the factors, you’d be stuck. Seeing them in the tool tips is nice but not practical. If you wanted to record them you’d be doing a lot of clicking and manual spreadsheet building.
Thankfully, recent reporting updates have changed the situation. The AdWords reporting API now has fields for the three main quality score factors. Each is ranked as below average, average, or above average. This still leaves room for interpretation but is much better than what we had.
You may be asking how to access the API. Don’t you need to know how to code? There is a shortcut and you only need to copy and paste a simple script. In general, any time that the standard reports are updated in the API, the same updates will be available via scripts.
Today we’ll go over a quick example of how to export the data to Google Drive and cover some examples of where to go next.
The Code
As with any script, we’ll go to Bulk operations > Scripts and paste the below code into the script editor.
function main(){

/*For additional detail and context check out the original post on PPCHero.com
For additional script help, see https://developers.google.com/adwords/scripts/
*/

//Report Builder - WHERE and DURING can be easily changed as needed to different values or metrics.
//For example you could filter on Clicks by changing line 13 to ' WHERE Clicks > 10 '
//For more help see, https://developers.google.com/adwords/scripts/docs/features/reports
var report = AdWordsApp.report(
'SELECT Criteria, CampaignName, AdGroupName, Clicks, Impressions, Cost, Conversions, QualityScore, SearchPredictedCtr, CreativeQualityScore, PostClickQualityScore ' +
'FROM   KEYWORDS_PERFORMANCE_REPORT ' +
'WHERE  Impressions > 25 ' +
'DURING LAST_30_DAYS');

var accountName = AdWordsApp.currentAccount().getName();
var spreadsheet = SpreadsheetApp.create(accountName + " Quality Score Report");
var sheet = spreadsheet.getActiveSheet();
report.exportToSheet(sheet);
}
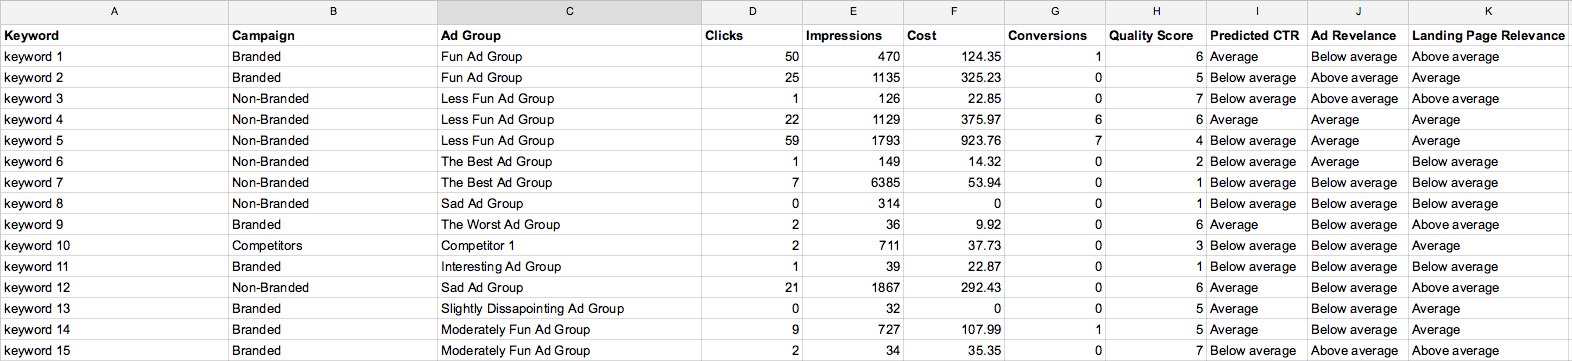
This script will take a few basic metrics and the Quality Score metrics and export them into a new sheet on the drive. The sheet will be titled Account Name + Quality Score Analysis and show up in the drive of the Google account you ran the script from.
Making Sense Of The Data
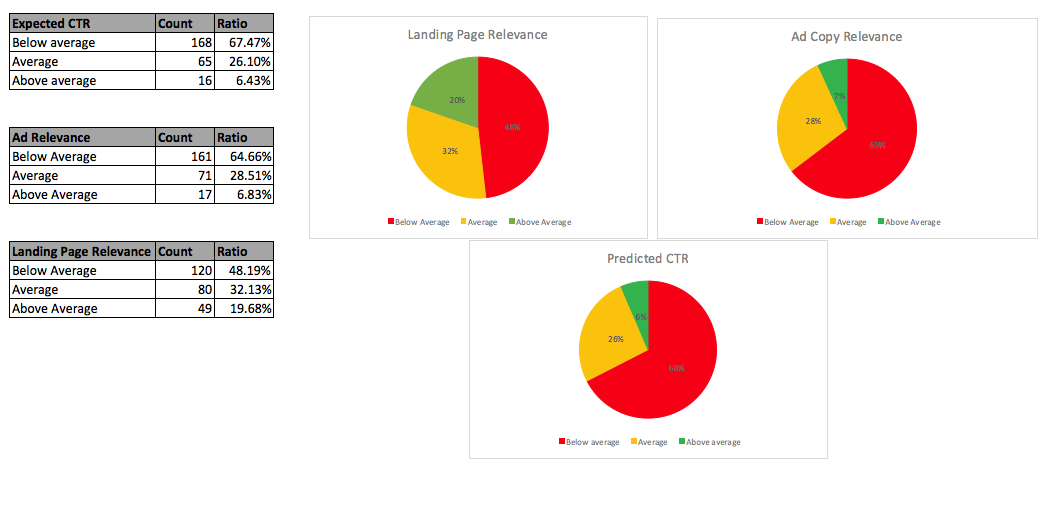
One of the quickest ways to make sense of this data is to build a few pie charts for each category, visualizing the distribution of each category. Are most of your keywords falling in the below average range for CTR or are landing pages the issue?

From the example above we should focus on predicted CTR. It’s the largest problem area, the highest weighted and one of the easiest to fix through ad testing. Who knows, you might even stumble into average and above ad relevance and knock out both.
If your landing pages are ranked as below average, consider testing alternative pages. If you have a small site, especially outside of ecomm, this can be a great opportunity to bring up landing page issues for CRO testing. Is there something off-putting on the page? A lack of relevant content? All of these factors could be potential issues.
What’s Next
The data pulled from the report isn’t revolutionary but gives us access to a better way to evaluate quality scores. Rather than relying on a single number, you can now see which factors are holding your keywords back.
Using the additional data, you can also evaluate weighted quality scores. This metric uses clicks or impressions to weight your average scores in favor of active keywords. If you are motivated, you can create a template workbook. Once you’ve set up the template you can run this report periodically and monitor as needed. I’d recommend running as the same report can be made applicable to any account.
Tracking Quality Score Over Time
Since AdWords does not track historical score, you have to do it yourself. If interested, you should check out a great script from Martin Roettgerding at PPC Epiphany. This simple to implement script exports Quality Scores to a Google Sheet at an interval of your choosing.
Quality Score Factor Weighting
Brad Geddes of Certified Knowledge wrote a great article on reverse engineering Quality Score factors. The article goes over the estimating ratings and what to expect in the future.
