

Projecting an account’s trajectory is a vital skill for every account team. You can’t escape it. It comes up when performance is great and it comes up when performance is poor.
Despite the demand for these skills and insights, it can be one of the scarier tasks. The uncertainty of accounting for everything makes it easy to doubt any method.
While there is no perfect method, we don’t have to completely guess either. If you, at least partially, surrender to the uncertainty you’ll realize how you can utilize certain methods to make better decisions and steer your account in the right direction.
This is a big topic! While there is not nearly enough space to go into full depth for each point you should be able to come away from this article with a few pointers, ideas, and at least knowing where to look when you need it.
Forecasting the immediate impact
Data Tables
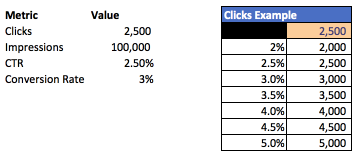
Data tables are a great way to examine the effect of changing metrics and the impact on goals. Data tables are an Excel feature that take a formula and build the results for multiple inputs. This saves you the hassle of updating a formula for every combination of inputs.
For example, you could take for formula for ROAS, profit, or total value. All of these are made up of a variety of inputs from CTR, impression volume, conversion rates, AOV, and so on. Data tables save you time by taking a defined formula and letting you choose a range of inputs. You can choose one or two inputs per table.
Here is an example for a one-way table with click through rate.
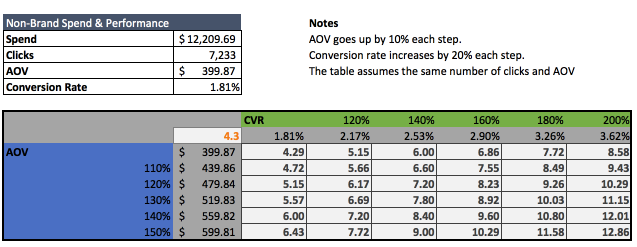
Here is an example of a two-way table with ROAS by different average order values and conversion rates.
Resources
PPCHero: How to Use Data Tables for Better Projections
Excel Solver/Optimization Methods
Solver is the tool to use when you know the metric you’d like to maximize or minimize, such as conversions, and have a set of constraints, such as budgets.

By defining a few formulas, such as total conversion volume by budget, you can set up a list on constraints. These could include spend by platform, spend by market, total available impressions, or max CPCs. Your formula will depend on your needs.
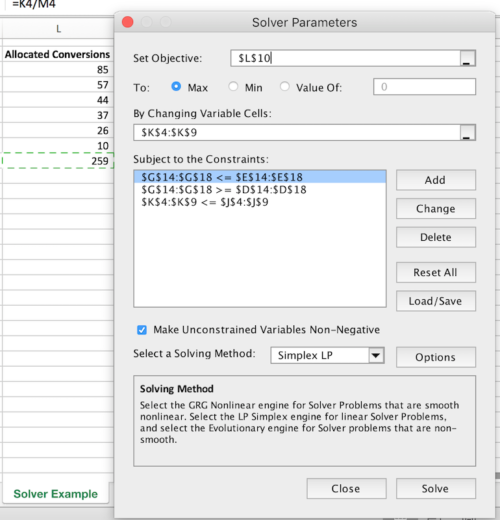
The tool will take those limits and attempt to find a solution to the formula that satisfy each requirement. The most common use case is budget. You would ask a question such as “What would performance look like if I could maximize by budget at $50,000/month?”
Resources
Whitepaper – How to Use Excel Solver To Power Your 2017 Budgets
How to Get More Out Of Excel Solver
Forecasting Long Term Impact
Basic Projection
Basic projections can be as easy as applying the average of the last x days to the next 30 days to get an estimate of next month’s performance.
By taking a slice of past performance, you can estimate future performance. This slice will vary depending on accounts. Seven day is a good standard. If you go shorter than a week you may end up over projecting, especially if weekends are particularly slow in your account.
If you’d like to forecast further than the next month, you could try examining a moving average over time. Rather than using a static number, you’d estimate then your metric of choice, such as conversion rate, increases by 2% on average very month. You would then take a basic projection and apply this weighting to it over each period.
This does take some guessing and rough estimates though as you can’t expect something like conversion rate to increase every period and you’ll hit some maximum sooner rather than later.
Resources
Easily Project the Future Performance of Your PPC Account
Five Steps to Master FaceBook Projections Not Predictions
Regression
Regression can be challenging in PPC due to the general noise in the data. Nonetheless is can work well if you set the problem up correctly.
Imagine a scatter plot of your data. Regression places the best fit line among the data to minimize the distance from each point to the line . You choose an output variable and an input variable. This could be revenue and spend or conversion and spend. Running the regression would place a line with a minimal the distance between the points on the graph.
If you just want to view the relation, you can plot a regression line on an Excel plot through the graph settings. Here is an example of from a set of app install campaigns.
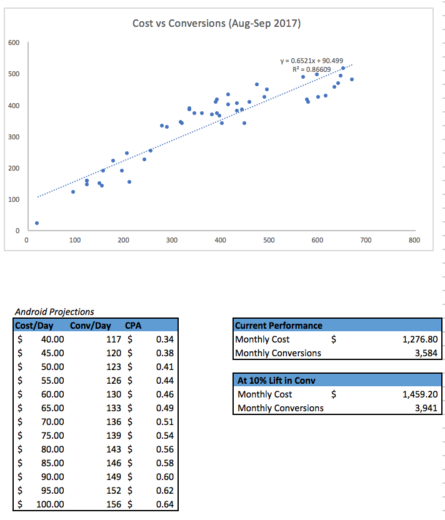
Regression itself is a large topic. If you’d like to dig deeper, Emma Franks has a great tutorial on running regression analysis for PPC in Excel.
Resources
Using Excel Regressions to Better Understand KPIs
Projecting Seasonality
Holt-Winters, or exponential smoothing, is an accessible method for adjusting projections for seasonality. This method is more involved than the basic projections but accounts for the regular ebb and flow of performance. For illustrative purposes, performance can be decomposed into the trend, which way performance is moving, seasonality, the regular cycle of performance, and noise.

For example, we can see the ebbs and flows of performance for an education account. Using this method, we can project forward and take those into account as we check out a potential future.

If you have experience with Python or R, or if you are just feeling adventurous, you can also check out Facebooks Prophet library. This approaches the same problem but via a different method and requires some coding. You can find and example below.
Resources
Finding Seasonality In Your PPC Accounts
Forecasting Made Skeezy: Projecting Method Demand Using Exponential Smoothing
Summertime Sadness – How to Adjust for Seasonality in PPC
How Accurately Can Prophet Predict Website Traffic?
Wrapping Up
We’ve covered quite a few approaches today, each worthy of multiple posts. If one of them interests you, you are only a few google searches away.
