


As the countdown to 2017 continues, sticking with the theme of wrapping up 2016 seems fitting. While PPC will continue full speed ahead going into 2017, one thing won’t change and that’s the performance of your PPC account in 2016. You may be thinking, “2016 was an amazing year, bring on the comparisons.” On the other hand, you may be thinking, “Well, we saw some dips but there is always next year.” Either way, reporting is almost inevitable and will more than likely drive decisions and conversations going into 2017.
Today, I will walk through three pointers for year-end reporting, where to begin, and where to keep the focus. You want to use the data to tell a story and avoid irrelevant metrics that won’t contribute or matter going into 2017.

Where To Begin
The hardest part is starting. If you are in excel, a blank spreadsheet can be intimidating and the worst thing you can do is to start creating reports that have no purpose and that just simply take up space. The second worst thing you can do is to start pulling reports without thinking it through. Then, half-way through a massive pivot table, realize you forgot columns vital to the report.
With that said, here are some questions you may want to ask yourself before you begin, which will drive the direction of your reporting.
- What is the goal of this report? Are you looking at how the account progressed throughout the year or are you looking at the difference between last year and the previous year?
- Can we accurately compare numbers YoY? Were conversions set-up correctly last year? Did something happen last year that will skew the data and create a non-accurate comparison?
- Where should the data be pulled from? Analytics or each platform?
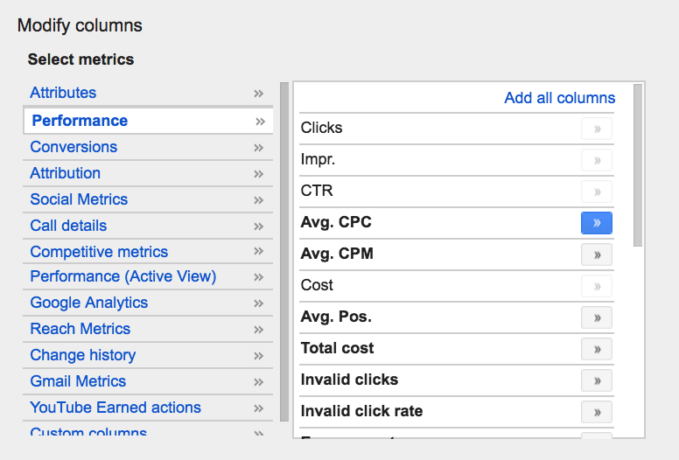
- What columns are vital to making all necessary calculations? What columns are irrelevant and shouldn’t be included? You can’t calculate CPA without including cost and conversions and you can’t calculate ROAS without including conversion value and cost.
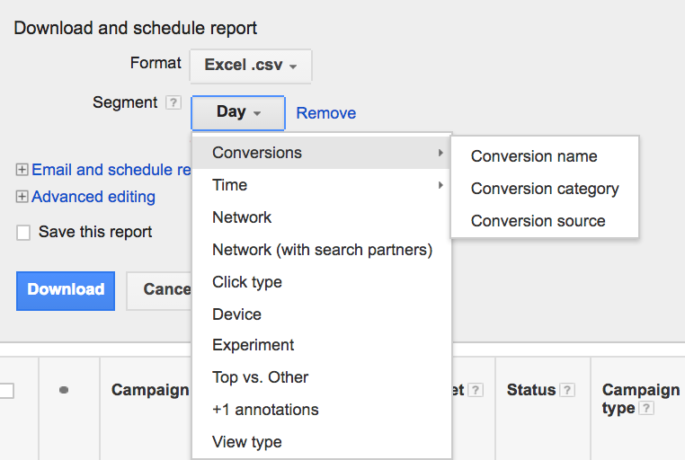
- When pulling the data, should we include additional segments like month or device?
- What KPIs should be the focus? If you are ecommerce and focused on ROAS, CPA may not be beneficial or meaningful. However, if you are lead gen and focused on CPA, ROAS may not be meaningful and more importantly, may not even be accurate depending on the way conversions are set-up.
- Do we need to segment the data into various product buckets or between brand and non-brand?
These are just questions to get you started but the main point is that you should go into reporting with a plan instead of going in blindly.
KPIs But Not All KPIs
This is probably one of the most import steps in terms of pulling the data. When thinking about KPIs, you want to use those that are relevant and that will contribute to the overall picture. To me, there is nothing worse than having to sift through columns that are irrelevant or looking for specific metrics that are nowhere to be found. I want to look through the data as quickly as possible and then draw conclusions based on the data.
![]()
With too many KPIs, two things can happen.
- The recipient will lose interest and get bored or confused going through the data.
- The recipient analyzes the data more than they should and instead of seeing that ROAS is up 50% YoY, they are questioning why CPA (which may be irrelevant to the business) is up 15%.
It’s all about perspective and being concise when creating large, year-end reports.
Owning The Data
Outside of generating the report, this is by far the biggest part of year-end reporting. Owning the data. It doesn’t matter how good or bad performance was/is, if you don’t know why the numbers read like they do, you have missed a vital step. Below is a completely hypothetical situation that shows the value in owning the data and spinning in circles with the data.
Peggy is an Account Manager and has just sent a report that includes the following information.
- CTR decreased 62% year-over-year, going from 4.2% in 2015 to 1.60% in 2016.
- Conversions increased 35% year-over-year, going from 740 in 2015 to 1,000 in 2016.
- ROAS increased 100%, going from $20 in 2015 to $40 in 2016.
Then, during the call to go over the numbers, the recipient only had one question, “What happened to cause click-through-rate to decrease by 62%?”
Notice that the recipient skipped the good and went straight to the negative numbers.
At this point, there are two scenarios:
- Peggy has no idea because she only focused on the increase in ROAS, since the ROAS goal was $30 and the recipient has never asked about CTR before. She then attempts to sway the conversation to the positive numbers and avoids answering the question.

- Peggy knows exactly why CTR is down and explains that during the year, 5 new display campaigns began running and that display campaigns see lower CTRs because they generate an increased volume of impressions but a lower percentage of clicks.
In the first scenario, Peggy went in circles with the data and wasn’t able to offer a feasible explanation. In the second, however, Peggy took the decrease in CTR and gave a reasonable explanation that made her look in-control of the data and added value to a seemingly negative situation.
Conclusion
While everyone has their own approach to year-end reporting, these are just a few pointers to get you on your way. It’s not about the positive or negatives but rather the story behind the data. The Titanic had a tragic ending but the story is what made it what is was. If the Titanic had sank without any explanation, James Cameron would have had a lot of explaining to do. However, he orchestrated a story to paint a picture of the events that led to the sinking of the ship.
