
You’ve asked for it, and here it is: The Total Guide To Product Listing Ads. We have a feeling this product will continue to expand and get cool, new features since it’s doing so well for our eCommerce accounts. But, there is so little information out there about how to set these up and make them work for you right now. We took it upon ourselves to put everything we know about PLAs into one, six part guide. We’ll be posting twice a week until all six parts are posted, so keep your eyes peeled!
Part 1: Setting Up Your Data Feed
Part 2: How to Set Up Your PLA Campaign
Part 3: How To Optimize Your PLA Campaign In Your Data Feed
Part 4: How to optimize your PLA campaign in AdWords
Part 5: Targeting Strategies
Part 6: Using Analytics to Measure Performance
First of all, navigate over to the AdWords Campaign report in Analytics.
Then, find your PLA campaign.
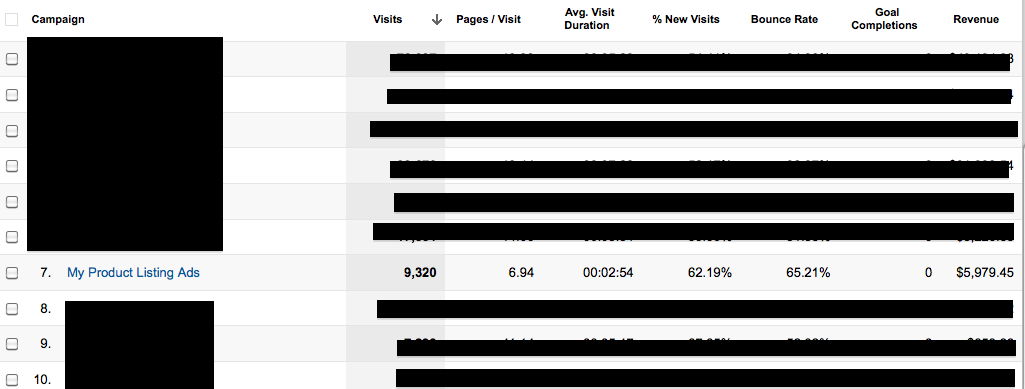
Now, you can find out whatever information you normally use in GA to measure your paid advertising. Bounce rates, pages/visit, avg. visit duration, goal completions for custom goals, etc. The beautiful thing about GA is that you’re really only limited by your own creativity in how segmented and complex you want to get with your data. I’ve always found GA to be a great source to flex my creativity, as it takes a great deal of creativity to be able to process all of this data in a way that actually impacts your account. So, let me flex some of that creativity right now and show you guys some cool stuff I look at in GA for my PLA campaigns. Hopefully you’ll find some useful ways to measure your PLA campaigns as well as be inspired to think of your own ways to measure performance in GA!
Product Report
The GA report I use most often for my PLA campaigns is the product report. If you have your campaign segmented by product types (as we’ve shown you how to do in other parts of this guide), then it’ll be helpful to know what products are actually being purchased in each segment. Sure, you can see what search query triggered a sale in your AdWords interface–but we all know that not everyone actually buys what they were searching for!
For this, I make a custom report. Looks like this!
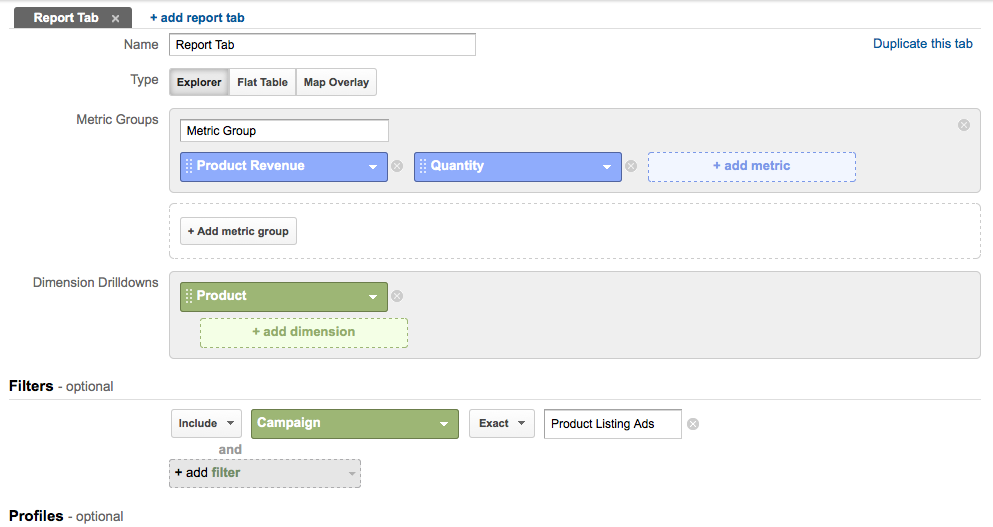
Of course, call the campaign filter whatever the name of your product listing ad campaign is. Mine is just called “Product Listing Ads” for this example.
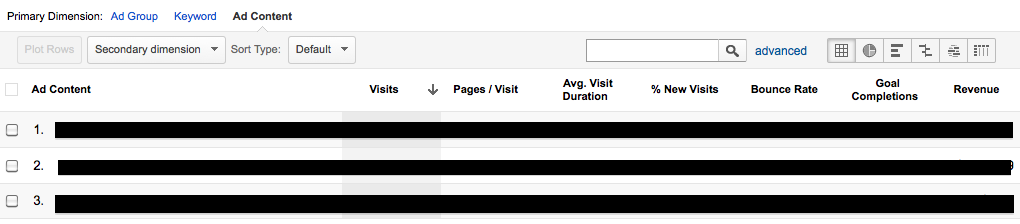
And then, if you’ve done all this properly and built an ad group for each target, you’ll just need to add a secondary dimension for ad group to this report! Looks like this:
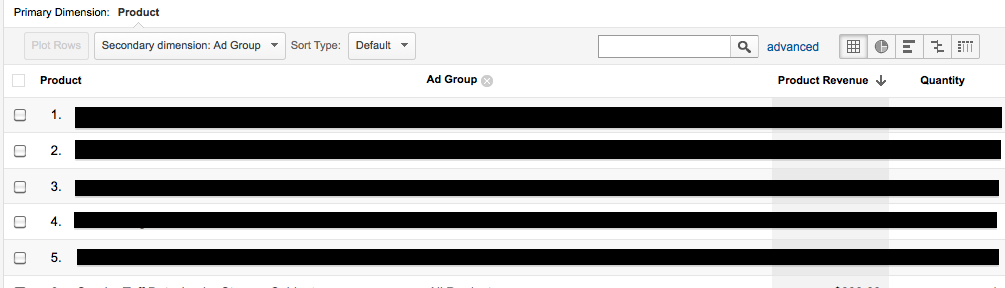
Sorry these screen-captures look so FBI top secret! But we wouldn’t want all out client data out in the world!
With this report I can see if there are a lot of particular product sales coming from inappropriate targets. This would be cause to see if I can better funnel them to the right ad group. It’s also just interesting to see what products people bought off each target, and some of my clients really like to see this report. In fact, I have this report emailed automatically every day for some of my clients!
Creative Reports
While you don’t customize ads with PLAs, you do customize your special offer message. You can check out more insights into their performance in GA. This report can be found under the regular campaign report in the AdWords traffic sources report. Then, just click on your PLA campaign.
If you play with the cool ways to represent the data on the right of the search bar, then you can see this stuff!
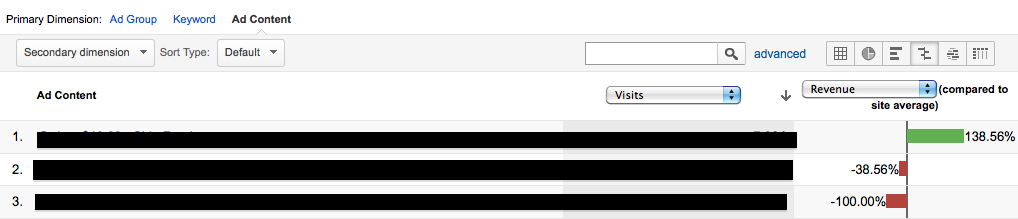
It’s a really cool way to see that my first offer is doing WAY better than my other two. Would even make a nice screen-capture to send the client!
ETC.!!
There are a million more other cool things to do, but their usefulness in terms of how they can affect your account is up to you. Here’s a neat example!
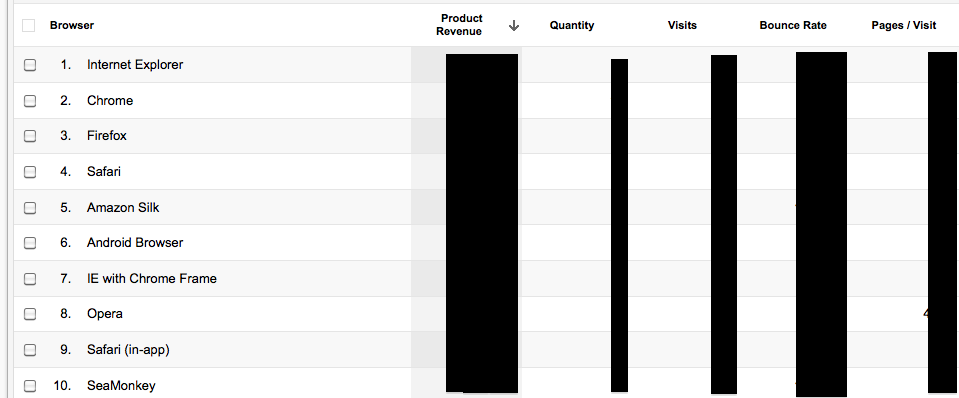
For this, I just copied the product custom report and changed it from product to browser and put in some extra metrics.
Again, you’re only limited by your creativity in what you want to look at and use to measure your PLA performance. What is your favorite way?!
