
Do you ever get frustrated with Google Analytics reporting for not having exactly what you want? I know the feeling. You want a column for cost and for each type of goal you have set up, but these don’t come in your standard reports in the interface.
Or maybe you’re just ready to step up your analytics game to the next level (and subsequently expose your inner analytics nerd).
Here’s where customization comes in. It’s time to get friendly with Analytics Custom Reports.
What Are They?
Custom Reports are exactly what they sound like, reports that you create within Google Analytics. You can either start from scratch, or customize one of the default reports.
How To Create Them
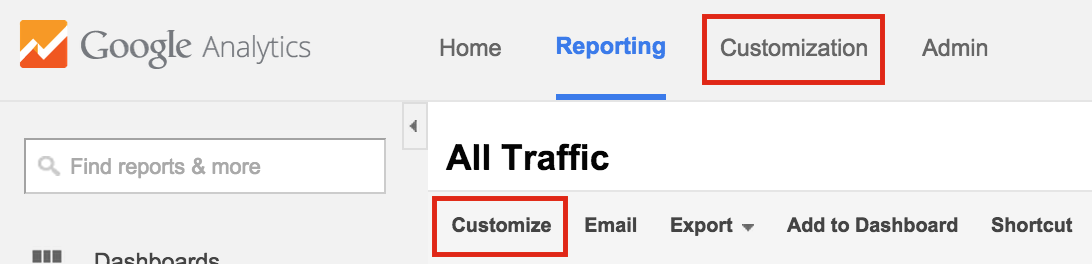
Creating your very own custom report is a snap. To customize an existing report, click the “Customize” button at the top of the Analytics interface.

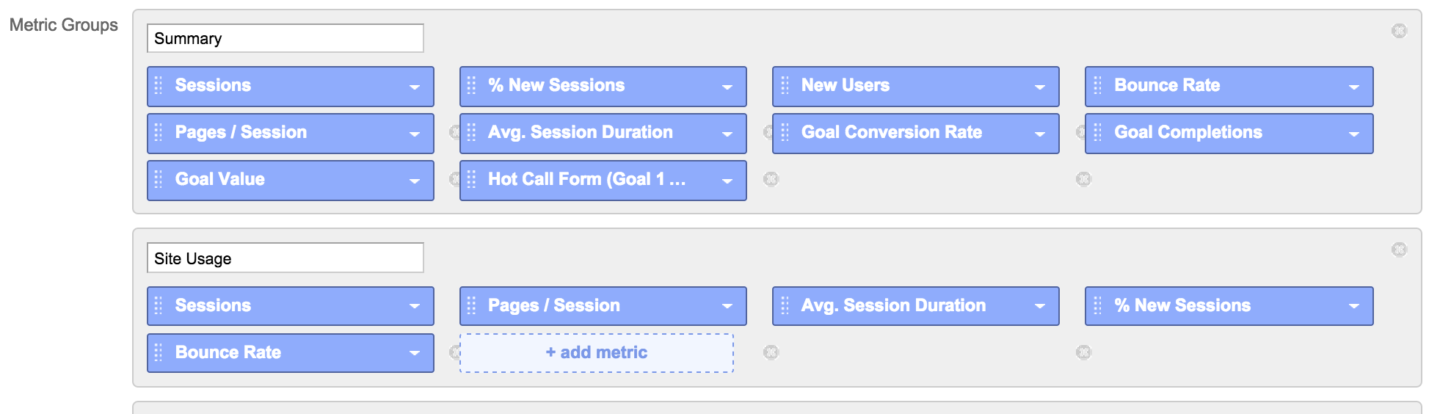
From there you’ll see a screen like the one pictured below, allowing you to manipulate which metrics and dimensions you’d like to include in your report. Remember, metrics are measurable, while dimensions describe your data (i.e., clicks vs. landing page).
To start a new custom report from scratch, click “Customize” at the top of the page, and then click on the “+New Custom Report” button.
Where To Find Them
Once you’ve created your perfectly tailored report, you will most likely want to revisit it time after time. Luckily, Analytics saves your custom reports in the Customization tab.
If you’re looking for some inspiration or pre-made custom reports, you can find them online (like here) and import them into your Analytics account ready to use. Once you’ve imported the report of your choosing, you can then tweak it to fit your needs.
How To Use Them
Once you’ve learned the basics about creating custom reports, now it’s time to think about what uses they have for your accounts. Whether you’ve got an ecommerce account and want to track revenue or your focus is on generating leads, we have some examples below to help jumpstart your creativity.
Ecommerce Example
For ecommerce accounts, you’re probably most often looking at transactions, revenue, and ROAS by source/medium or campaign. Something that you may be overlooking, but might provide some interesting insights, is page value.
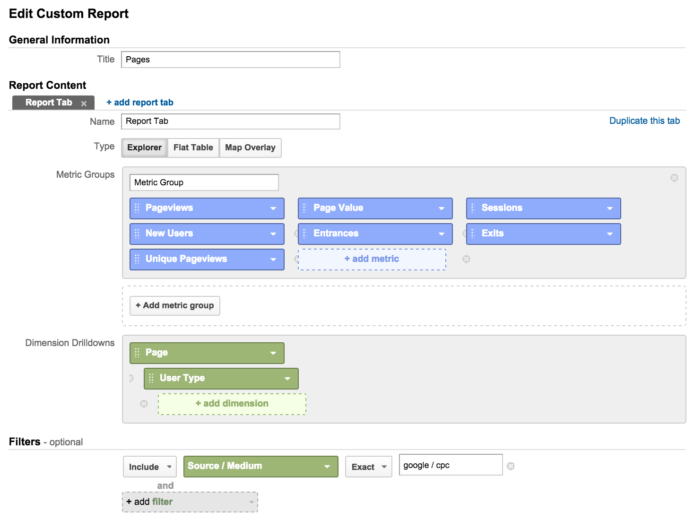
This example report will display pages visited by AdWords traffic, with page value (revenue/pageviews).
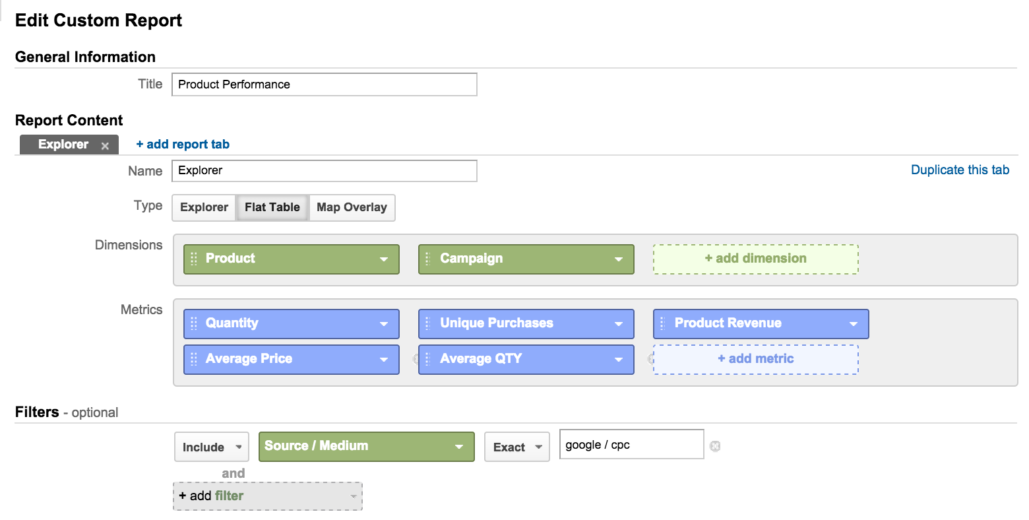
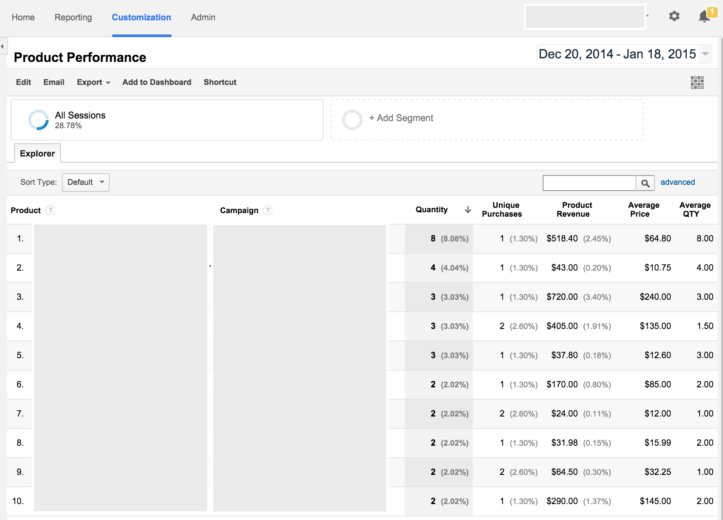
Another great use of custom reporting is the Flat Table feature. For ecommerce, rather than navigating to Conversions > Ecommerce > Product Performance, adding a secondary dimension for campaign, and then filtering for google/cpc, simply create a custom flat table and have the information already there for you! Easy as pie.
Lead Gen Example
For Lead Gen accounts where you’re not necessarily concerned with revenue numbers, you can still make use of custom reports to easily access goal data and other valuable KPIs. For example, view all of your goals in one place, segmented by Source/Medium:
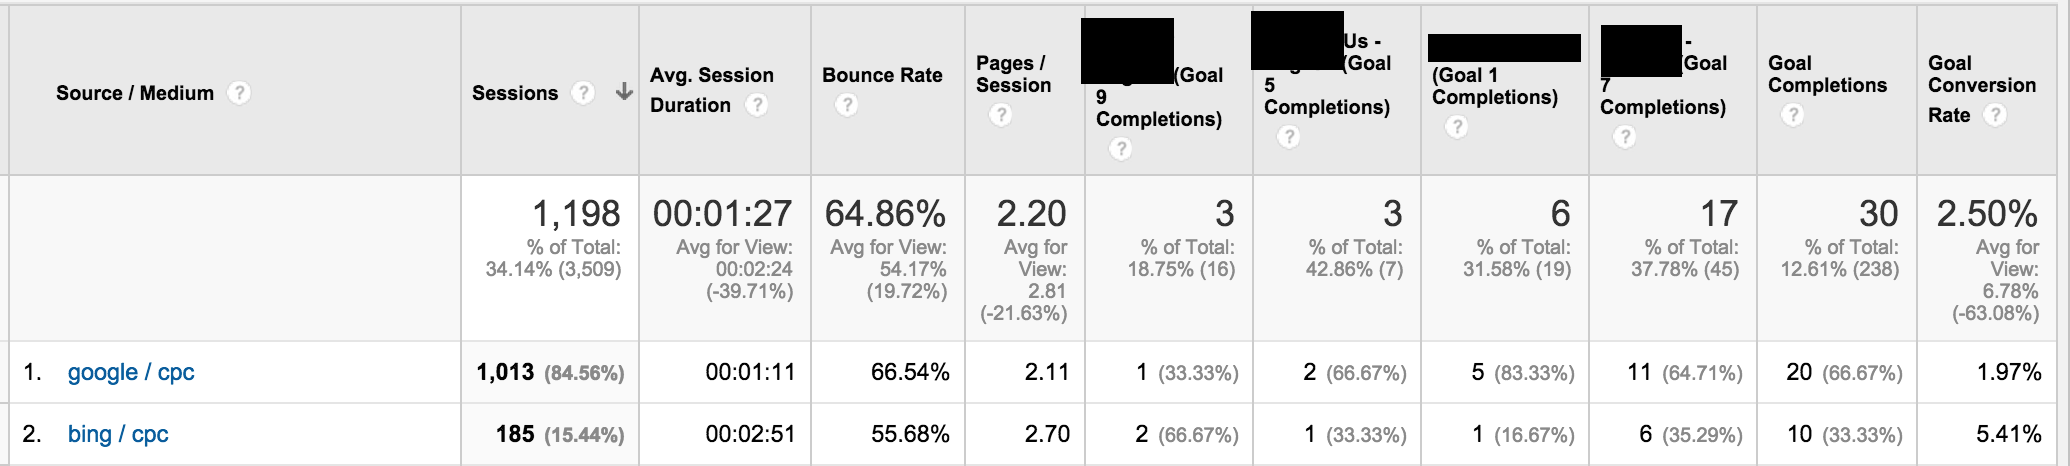
This one’s particularly powerful if you’ve got multiple goals set up, but want to see how they perform separately by channel. This particular account has multiple types of goals, and likes to see them reported by source / medium. Unfortunately you cannot have each goal displayed individually in the source / medium report, so you’ve got to create a custom report.
Another option for a custom report is to view keyword match types with metrics such as bounce rate, time on site, etc.
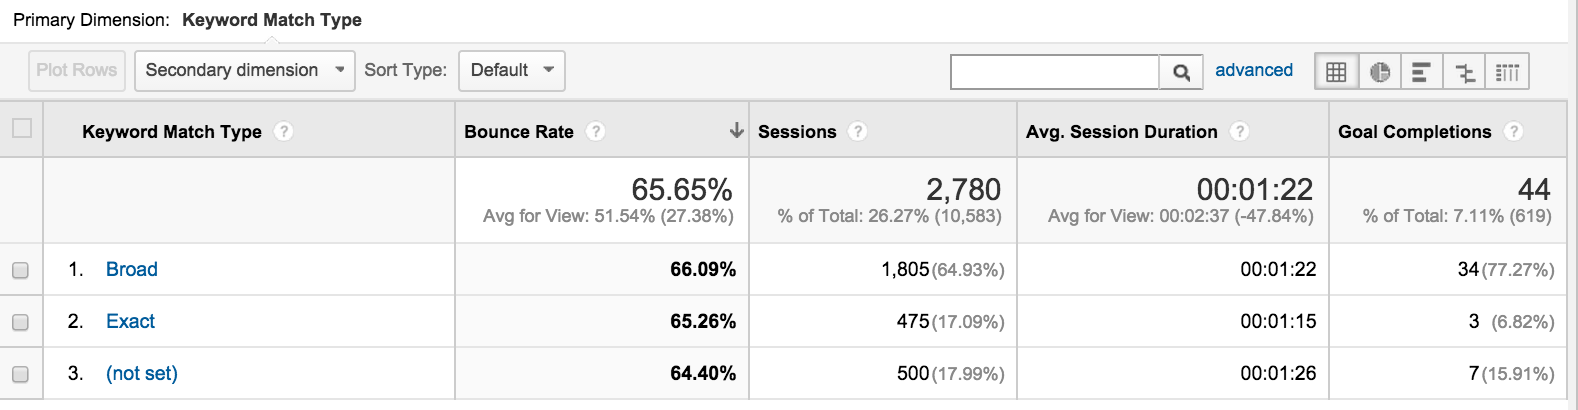
Again, the customization options here are endless. Tweak the report to include whichever metrics and/or dimensions are important to your client (in the example above, we are using bounce rate and avg. session duration as KPIs).
Benefits
- Easily see data from non-Google/Bing advertising channels
- Pull in lead data from Facebook, Twitter, LinkedIn and see how they compare to Google and Bing
- Share reports across accounts
- Analytics allows you to easily access the same report across multiple accounts
Limitations
There aren’t many downsides to using custom reports, but there are a few things that I’d like to see Google implement.
- Secondary Dimensions – I would love to be able to set a secondary dimension that will always be enabled on my report.
- Segments – By default it will use whatever segment you had enabled before you went into your custom report, but it would be useful to be able to specify which segment you always want to use for a particular report.
Closing Thoughts
If you’ve got any Analytics reporting that is somewhat of a time-suck, don’t hesitate to take the time to build a custom report. It may feel time consuming in the beginning, but it will save you precious hours later on. The possibilities are (nearly) endless, so get in there and experiment with custom reports!
