
Search query reports are a fact of life in paid search. No matter how great your keywords are, there will always be queries that, for better or worse, don’t quite match your target.
Although it’s a crucial part of account success, the web interfaces leave much to be desired. Choosing queries one by one and setting them as negative or adding them as keywords is inefficient and leaves you with a poor view of the situation.
Thankfully, we have spreadsheets to help us out. Today we’ll cover a few techniques for utilizing Excel to get more from your search query reports. We’ll skip the basics like using sorts and focus on leveraging additional features and formulas to better understand the data.
The Basics – How To Get By
Filters
Utilize filters to find queries in bulk. Filters allow you to efficiently survey and extract sets of queries form the thousands of rows to data. Filters can also give you the scope of an issue. For example, is the issue a handful of queries or a massive list of small leaks? This analysis can further drive your decision to either block or implement specific keywords or reassess your larger targeting strategy.
Do you happen to sell car engine accessories? Filter for “boat,” “marine,” “motorcycle,” “lawnmower,” etc. Copy and paste the matched rows into a new sheet and set the match type to negative and upload them. Alternatively, you may see the queries are so irrelevant or so widely spread across your account that you opt for a negative keyword list.
Pivot Tables
Pivot tables can be your savior when it comes to completing SQRs. This statement should come as no surprise as just about every PPC problem can utilize pivot tables!
One of my favorite ways to use pivot tables is evaluating how often the same queries match to different keywords, ad groups, or campaigns. If the same query is showing up in too many areas, it means your keywords are not funneling correctly and you may be showing a suboptimal ad.
You also run into issues of the same potential traffic moving from ad group to ad group whenever you implement bid changes or negatives. This creates small leaks that detract from efficiency.
Beyond the standard metrics, you can further utilize pivot tables to make sense of segments such as month or device. Building a table with standard metrics and implementing the desired segment can help you see the variance over time of a query or device preference. Both of which can help you plan a seasonal or device based strategy.
If you need a little inspiration, here are 4 easy to build tables to get you started.
Filters and pivot tables will take you most of the way and are mandatory for running a successful account. What do you do when you want to dive deeper, though?
Diving Deeper – How To Have Fun
How Long Are The Queries?
Are most of your queries brief and to the point or are they sprawling masses of strung together words? Knowing this information can give you additional insight into your keyword strategy.
If you have successful queries with high word counts you can take advantage of it by implementing longer keywords. Competitive markets will include many advertisers using broad coverage to catch anything. Longer queries may help differentiate your targeting and limit the competition.
Excel cannot directly give a word count but we can use a somewhat simple formula (you may just want to keep an example close by to copy and paste).
It may seem clunky at first but it basically looks for a space as a work break and counts those and adds one. If you have four words, you’ll have three spaces between them.
=IF(LEN(TRIM(C19))=0,0,LEN(TRIM(C19))–LEN(SUBSTITUTE(C19,” “,””))+1)
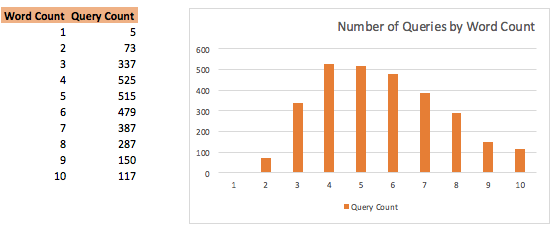
Once you have the formula in place you can use count() to count the number of queries at each length. Using the table, you can then start to plot a simple bar graph like the one below.

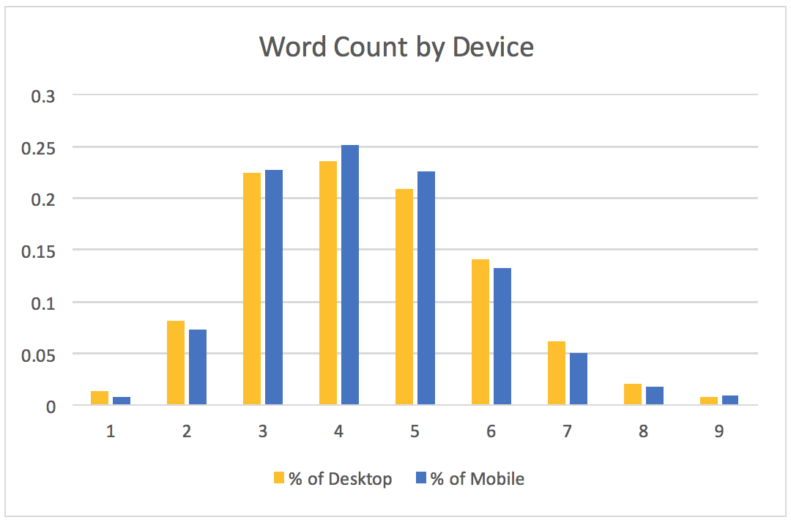
You could even get a little fancier and use other formulas to calculate the average CPC, CPA , and so on of each query length. Alternatively, you may try looking at query lengths across devices.
One thing you’ll want to keep in mind is brand names. If a brand name (your’s or other’s) is often used it can skew the distribution. This note isn’t to say it’s wrong, but it is something to be aware of. If the name of a business is “National Homecare Service Solutions,” query length will skew towards four words and above.
What Makes Up A Query
Although there may be many unique queries, they will often fall into themes with distinct modifiers and key terms. Understanding how a term fares can help you assess the value as a whole and better understand search behavior. Are buyers’ price conscious and often searching for “cheap” or “affordable” or in many cases are these two distinct in that you should target one but not the other?
We can review easily with “sumif” or “sumifs.” The only difference is the number of arguments. Both formulas will allow us to sum a total when the proper conditions are met. This removes the need to segment your current sheet or create new tables.
=sumif(range to check, the value you want to check for, the range to sum)
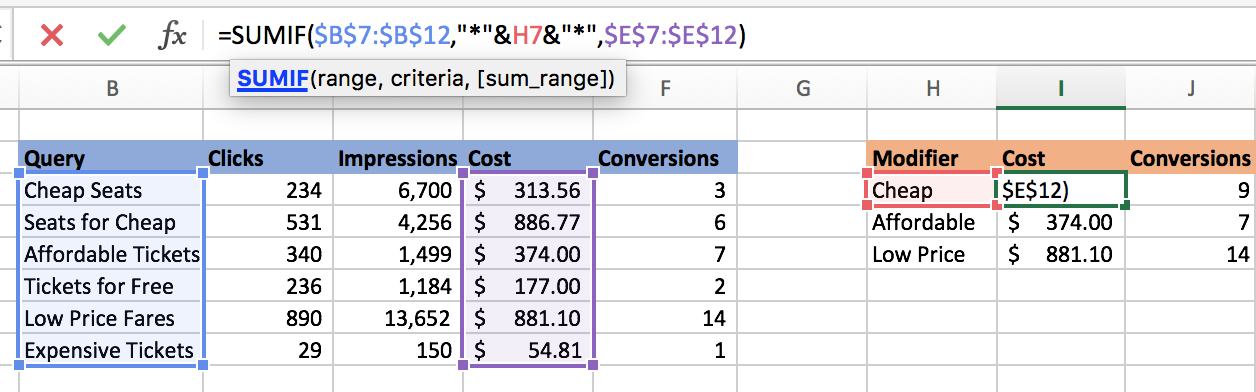
You can repeat this formula for any term or value you want to sum. Note the asterisks on each side of the H7 reference. These wildcards act as an “any character,” meaning the sum will include any query that includes the term, in any position. If we only wanted to check terms that start with cheap we would remove the leading asterisk and make it H7&”*”.
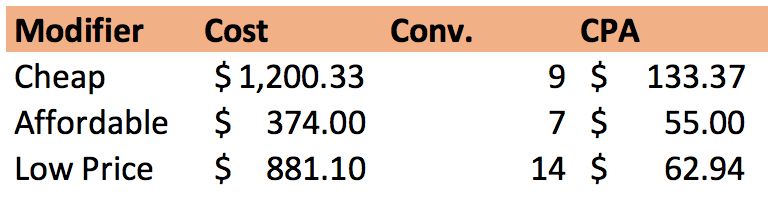
In this example, “cheap” terms are not great performers compared to the others but they make up a large volume of clicks and spend.
In this situation, you may opt to create new ad groups focused specifically on cheap. From there you may opt to bid down, to keep the cost down, or you may try to different messaging or landing pages to take advantage of this large segment. Whichever option you choose, you’ve taken the extra step and put yourself back in control of performance.
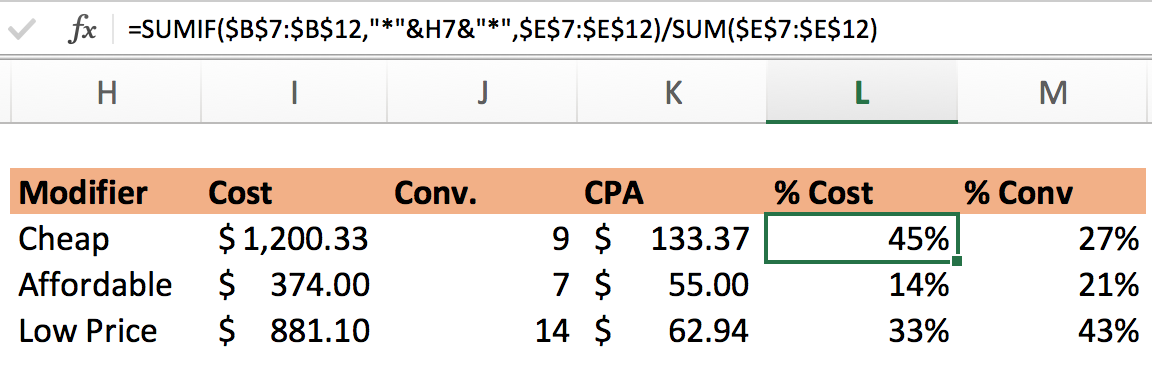
One way to make this decision easier is to combine “sumif” and “sum” to see how much of the total spend, cost, conversions, etc. were dedicated to the term. Large discrepancies between ratios can provide opportunities for optimization.
